Point and figure charts are the most simple and easy to interpret charts in stock markets. That’s the reason Point & Figure charts have been in use for so many years in the stock market field. Learn to read - and construct those charts by yourself!
Introduction
Point and figure chart analysis has been doing good work for the investing communities for many decades now. These charts are great sources for decision making in stock investments. Point & Figure charts were used by stock traders before the wide spread use of computers and sophisticated software made other types of charts readily available. With the availability of modern charts and with the ability of making sophisticated charts using high end computers and software codes, the prominence of P&F charts deteriorated some – but they are still a very useful tool for price-tracking.
Simplicity is the key
One major advantage of P&F Charts is that they are very simple to make. Either with a graph paper or even with a ruled paper you can draw your own point and figure charts. You require only stock data from a stock market report or a newspaper and pencils. It is very easy to update it or redraw it. You can make any number of point and figure charts in a day – and you can keep the point and figure charts of the previous days and assess the fluctuations in the market prices through analysis of the charts.
The technique
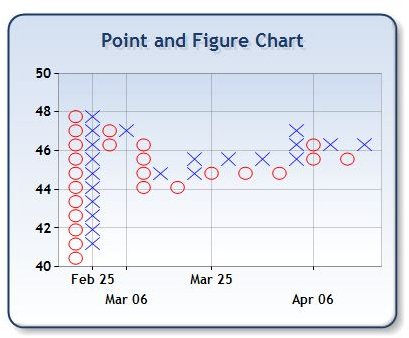
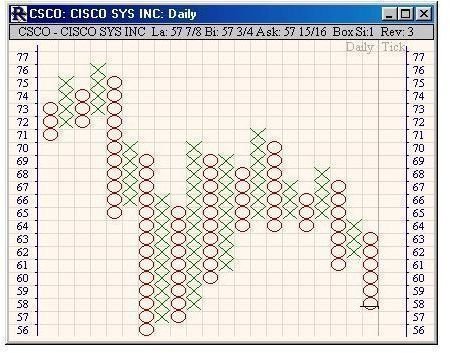
A Point & Figure chart in the stock market arena is a method of data tracking. Simplicity is the face of the point and figure chart. These charts are the graphical representation of supply and demand in the stock markets. The point and figure charts are typically contain columns of Xs and Os. Rising of the price is shown by Xs and the falling prices are marked by Os. And time has no meaning. You mark a new X’s once the stock is up by a predefined amount (box size). So if you have a column of X’s, the stock price is 10 and your box size is 1 you should add an X only when the price surpasses 11. Alternatively, you should start new column of O’s once the price is below 9 (actually the switch form X to O’ can be other than box size - it is called reversal size and can be equal to 1, 3 or 5 times the box size).
Point and Figure charts

Advantages
Point & figure charts filters out insignificant small variations in stock prices. In fact one of the problems with the bar chart is the presence of insignificant price movements making it clumsy. When you consider time factors in the charts, it is true that there can be many distortions and interpretations with respect to time. This can lead to the missing of factual observations in the market. With removing the time factor, the underlying trend the stock market is perfectly shown up in point and figure charts. It displays what is really happening in the stock markets. As any financial expert knows, time does not play much significance when we consider demand and supply of the stocks. Another important aspect is that the Point&Figure charts do not contain any noises of the stock fluctuations.
Making use of Point and Figure
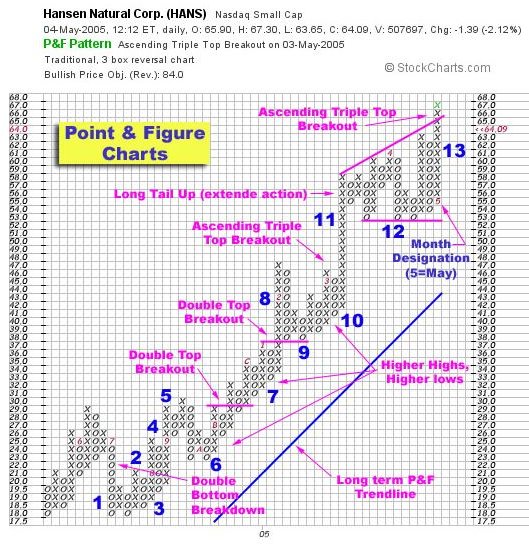
Point and figure charts help to identify clearly the support levels form the market and also help to realize the resistance levels. This in turn helps the investing community in decision making process of buying and selling. You can make the trend line setting from the charts and can reliably depend up on it by the careful analysis of point and figure charts. For instance, in the forex market it is said that good buy signal is whenthe new column of X surpasses the previous one. Alternatively, the sell signal is when the O’s gets lower than the previous one. Point and figure charts help the users to understand the long period price movements. It is extremely useful in identifying the long term investment portfolios.


