Using Google Analytics can be a very personalized experience, and it should be as your Web site is personalized to you or your business. Let’s talk about customizing the Dashboard in Google Analytics and how it will help you.
What is the Dashboard?
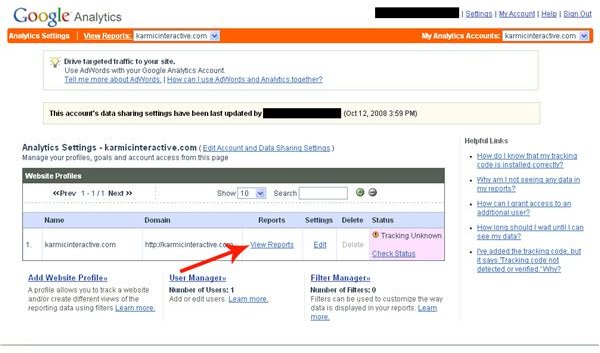
The Google Analytics dashboard is your gateway to all the information about your Web site. On the dashboard, you will be able to choose reports that will be ready and waiting for you at a glance. These reports will allow you to see a variety of statistics about your Web site and even the goals you have set up to measure the success of your Web site. Once you log in to the Google Analytics, you’ll need to click “View Reports” as indictated by the red arrow on the photo at the the left.
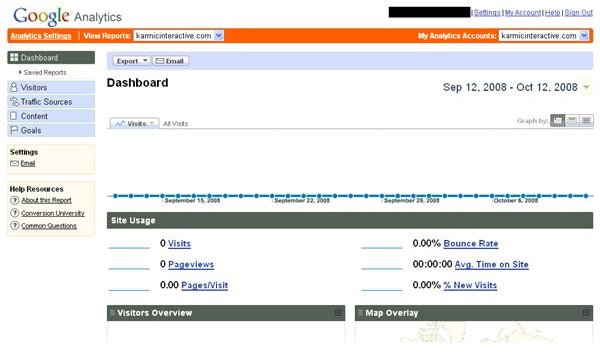
Your dashboard should look something like this:
Rundown of Sidebar
Now, let’s do a brief rundown of the sidebar so you’ll know what you are adding to the dashboard. The sidebar contains the following:
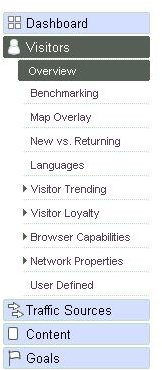
- Dashboard: Use this to get back to your main dashboard.
- Visitors: Use this to find out information about the visitors to your Web site.
- Traffic Sources: Use this to find out where your visitors are coming from so you can adjust ads.
- Content: Use this to find out about your content, what’s working, what’s not, etc.
- Goals: Use this to set goals to see how well your site is measuring up to what you want it to be doing.
Beneath each of these, you’ll see a series of reports that you can add to the dashboard. For example purposes, because each one will have a further detailed article soon, here are a few:
- Visitor Trending: This will show you several statistics about your visitors and their behaviors on the site.
- Browser Capabilities: This will show you several different aspects about the computer the user is using to view your site.
- Map Overlay: This will give you a geographical representation of where your viewers live.
Adding, Removing and Adjusting Reports on your Dashboard
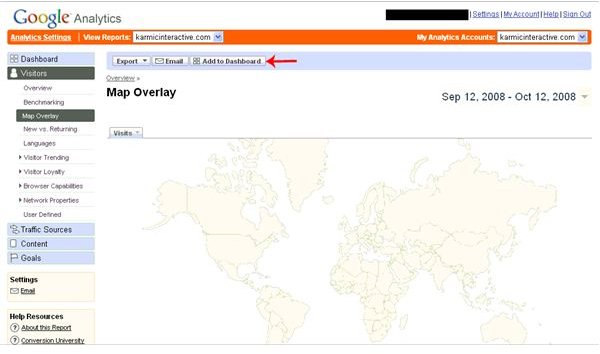
To Add a Re****port to your Dashboard: Using the sidebar, choose the section and report you want. As demonstrated in the image, click the “Add to Dashboard” button, where the red arrow points.
To Remove a Report from your Dashboard: On your main dashboard screen, scroll down to the report you want to remove, and click the “x” in the upper right corner as demonstrated by the red arrow in this photo.

To Change the Placment of a Report in your Dashboard: Simply drag and drop reports where you want them after they have been added to your dashboard.