The most significant constraint of the wind force is the wind speed. For this rationale, understanding wind ratings via Weibull Distributions and Raleigh Distributions is very important. This article explains how to interpret Weibull and Raleigh Distributions for wind velocity.
Introduction
Navigation and agriculture has been using wind energy for centuries, but it is only during recent times that wind energy has been getting a lot of awareness due to the concentration on inexhaustible energies. The successful fitting of statistical distributions like the Weibull Distribution and the Raleigh Distribution to wind speed data in wind energy means having a thorough understanding of the wind features at any particular location. Not only is understanding wind ratings important, but at the same time how to interpret the Weibull and Raleigh Distributions for wind velocity is also crucial. Precise data about wind velocity is significant to determine best sites for wind turbines. Wind speeds also have to be calculated by those who are apprehensive about the dispersion of airborne pollutants.
Apart from this the energy requirement of the world is always increasing by 4-5% every year while fossil fuel reserves which address this want are decreasing much quicker than the need. Additionally, with the increasing, depressing consequences of fossil fuels on the environment, primarily developed countries and others have started utilizing renewable energy sources. These days, the most growing and most commonly utilized energy source is wind energy.
Thus, when using energy from the wind, the most crucial parameter, that is wind velocity, has to be calculated, and this is where Raleigh and Weibull distributions play a part. Let us examine how and what are these methods or models.
Wind Power
What is a Weibull Distribution?
The Weibull distribution derives its nomenclature from the Swedish physicist W. Weibull when he used it while examining material durability in stress and fatigue in the 1930s. Nevertheless this method provides a close estimate to the probability laws of numerous natural developments. The Weibull distribution has been utilized to constitute wind speed distributions for covering wind loads studies for some time. In modern years most concentration has been centered on this technique for wind energy applications. This method is used not only because of its better flexibility and ease, but also due to its effective provision of a good fit to experimental data. The Weibull distribution is qualified by two arguments: the shape parameter k (dimensionless) and the scale parameter c (m/s.).
The Weibull distribution is represented as a graph to point out wind speed uniformity and difference and has two arguments. The parameters of Weibull distribution are:
Weibull shape parameter k
The Weibull shape parameter helps in determining how frequently overall wind speeds are inclined to be close to a definite speed by equating how directly the mean wind speed is to the median of distribution for the diverse wind speeds. The median value of distribution is in fact the point on the graph that sets the location of equal wind speeds distribution. This actually means that the wind speeds are distributed equally on both sides, i.e. half of the time the winds are more sluggish than the median and half of the time they are quicker than it. The shape argument is established on a ranking from 1 to 3. It can be:
- High wind variations
- Moderate wind variations, or
- Consistent wind speeds.
Weibull scale parameter c
This parametric quantity determines how windy a place is by taking the entire distribution of wind speeds. The more high-pitched the scale parameter, the more windy the place is.
What is a Raleigh Distribution?
The Raleigh Distribution is a statistical arc whose shape estimates the real shape of a wind speed distribution curve. It is applied as a consistent distribution curve to calculate the energy creation operation of a wind turbine.
The Raleigh distribution is applied as an example for wind speed. The model explains the circulation of wind speed over the period of a year. This kind of study is utilized for forecasting the energy retrieval from a wind turbine. In reality the speed of the wind and its loads varies by time of day, that is between day and night as well as between seasons. This deviation of wind speeds over the year has a significant effect on economic value of wind propagation.
The Raleigh distribution, which is used in probability theory and statistics, is used when wind velocity is examined in its orthogonal 2-dimensional vector elements. Taking for granted that the scale of each component is not correlated and normally dispersed with same variance, then the entire wind speed will be qualified by a Raleigh distribution. The Raleigh distribution takes on the following probability density function:
The Raleigh distribution develops if the wind speed and direction are both Gaussian variables, then the transmitter wind speed builds a Raleigh distribution.
To calculate Raleigh distribution and to plot graphs please visit Solvemymath.com .
Windy Feeling

Next: Interpretation of Weibull Curves and Raleigh Distributions
Interpretation of Weibull Curves
Another critical conception to comprehend wind power is to calculate wind speed. People who are relatively new to power harvesting from wind might feel that if they can set up a small, 4-foot wind turbine with 400 watts rating then they will get 400 watts power. But this is not correct. Actually, at most sites the wind blows only at low speed which is around 5-15 miles per hour. Thus low winds do not have much power unless they are swept with a big rotor.
Weibull curves
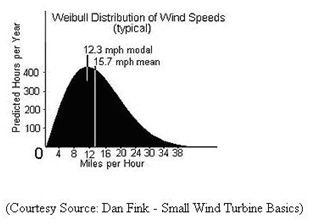
In the graph above (please click to enlarge), the horizontal axis depicts wind speed, and the perpendicular axis shows the probability at which the wind is blowing at a particular speed. The region under the chart is at all times equivalent to one, since the likelihood that wind is blowing or not blowing is all the time 100%. You can make use of an anemometer to calculate the wind location for wind potential. If you want to experiment with different values for the Weibull parameters to get a grasp of what the wind speed probability distribution looks like then try here.
Raleigh Distribution
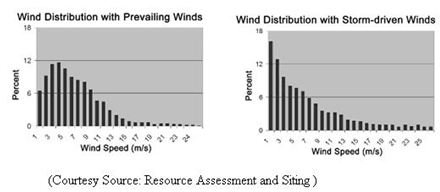
The above graph depicts instances of Raleigh frequency distributions at a location with strong existing winds and at a location with stormy winds. Raleigh frequency distributions are used to estimate annual energy production when merely a yearly mean wind speed is known. The Raleigh distribution takes on a general distribution and should merely be applied for opening energy production figures.
Conclusion and Reference
Deciding whether investment would turn out useful or not for a planned wind plant in any region can be determined with the help of wind speed data measured for that region. Consequently allocation of the wind speeds in that area is inquired for extended years. Since wind speeds are defined as haphazard events, it is predictable to fit the data into a probability distribution. Hence the distribution to which the wind speed is appropriate, is considered.
Thus wind speeds in the largest part of the world can be prototyped using the Weibull Distribution. This statistical instrument informs us as to how often winds of diverse speeds can be found at a site with a certain mean wind speed. This will help us to select a wind turbine with the most favorable cut-in speed, which is otherwise the speed of the wind at which the turbine begins to generate usable power, and the cut-out speed, which is the wind speed at which the turbine attains the maximum value of its generator and can no more bring out modified power production with additional gains in wind speed.
References:
The Energy Groove - Energy and Cost Calculations – Wind Turbines
Rosa, A. V., “Fundamental of Renewable Energy Process”, Amsterdam: Elsevier Inc.
Celik A.N. A statistical analysis of wind power density based on the Weibull and Raleigh models at the southern region of Turkey. Renewable Energy, vol.29, no.4, pp.593–604.