Are you experiencing the dreaded BSOD - blue screen of death - in Vista? If so, you can use free tools from Microsoft to examine the automatically-created crash dump file to learn the name of the driver responsible for the crash and maybe find a cure. Here we go step-by-step through the process.
Introduction
The default crash action in Vista is to display an error message on a blue screen (BSOD), dump the contents of memory into a diagnostic file, and restart the computer. From running to crash to restart usually happens quickly - too quickly to actually read the error message. In this article, we’ll look at using some tools from Microsoft to analyze the dump file and hopefully discover which driver, process, or application caused the crash. By crash, we mean a conflict that provides a sudden, unexpected stoppage of the system. These stoppages occur when Windows does not know how to deal with the conflict.
Download and Install the Debugging Tools
Start by going to the Windows Hardware Developer Central (WHDC) Overview webpage . Find the link that refers to your operating system. For this PC, we selected “Install Debugging Tools for Windows 32-bit Versions,” but a link for 64-bit Windows is there, too. On the next page, we selected “Install 32-bit version 6.11.1.402 [16.9 MB].” The downloaded file was named “dbg_x86_6.11.402.msi.”
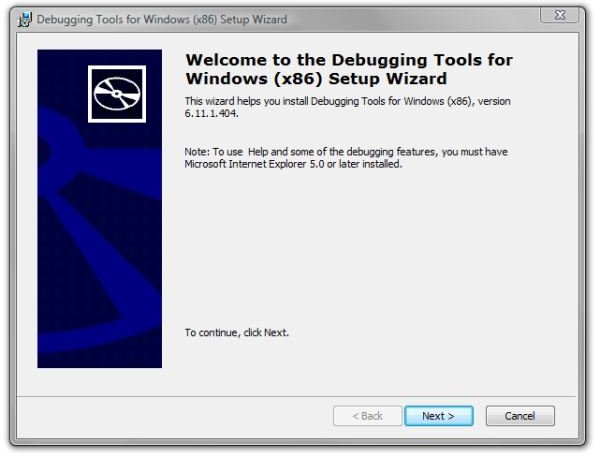
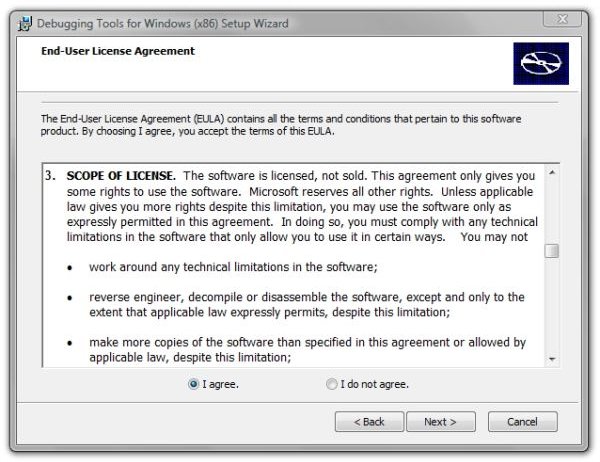
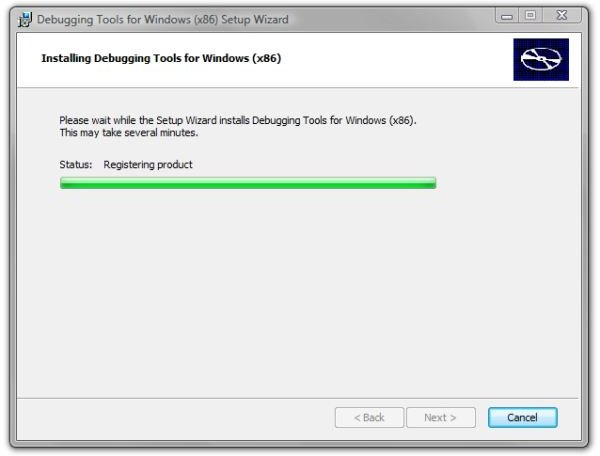
The following images show the installation routine after double-clicking the .msi file.
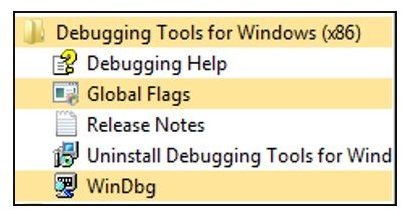
And a new “Debugging Tools for Windows (x86)” section appeared in the Vista Start menu.
Recover the Dump File
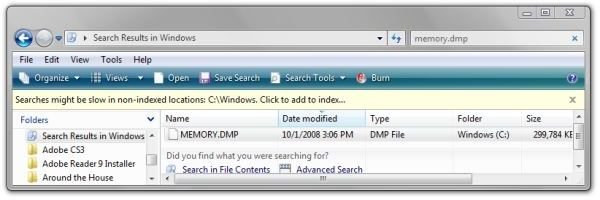
Locate the dump file in the root of the Windows directory. An easy way to find it is to start at Computer and navigate to C:\Windows. Then type “memory.dmp” into the search field at top right.
In order to work more easily with the dump file (and avoid some needless UAC prompts) we need to change the permissions of file so the user has full control over it. Drag the file from the Windows folder to your desktop or to a folder on the desktop.
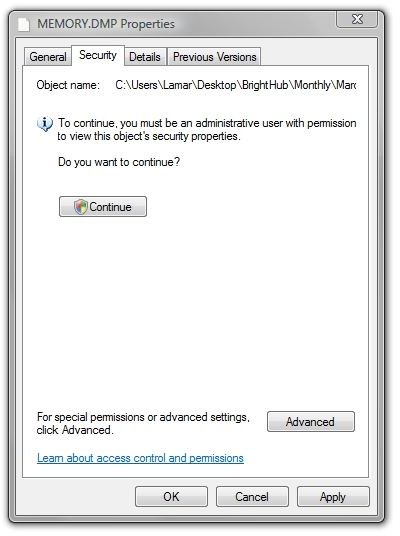
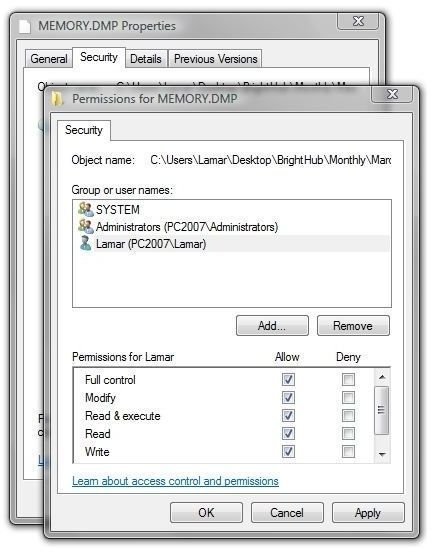
Then right-click the dump file and select “Properties.” Under the “Security” tab, click “Continue” and then clear the UAC prompt. (First image below.)
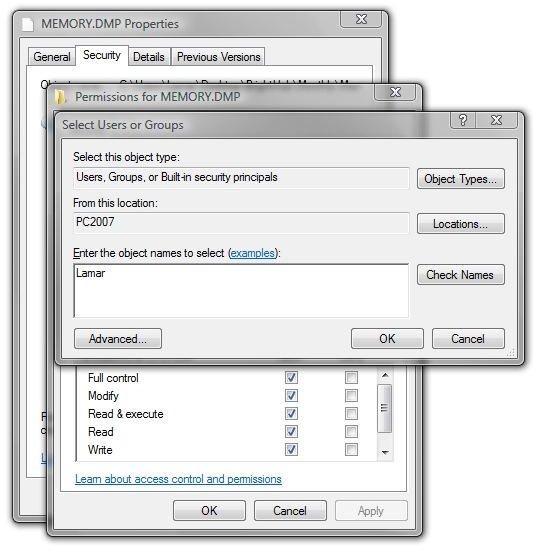
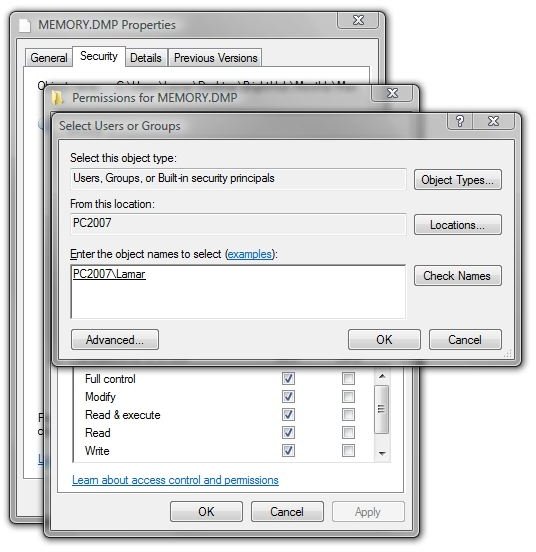
In the “Select Users or Groups” dialog, enter your Windows log-in or user name and click “Check Names.” Mine came back as “PC2007/Lamar.” (Second and third images.)
With your name high-lighted, check “Full Control” and then click OK. (Fourth image.)
Symbol Files
You may have noticed that the first page we visited at WHDC suggested downloading the symbol files for your version of Windows. In researching for this article, I did that and had problems. However, there’s a much easier way to load the needed symbol files without downloading the entire mass of them. Instead, we’ll ask the debugger to only download the symbol files that it actually needs.
To set up the symbol files, first create a folder for them: Computer → C: Drive → right-click and select “New… folder.” We followed Microsoft’s suggestion and named it “websymbols.”
Now we need to tell the debugger to use it. To do this, click the Vista Start button/orb and navigate to All Programs → Debugging Tools for Windows → WinDbg. In the WinDbg window, select File → Symbol File Path. In the “Symbol Search Path” dialog, enter
SRV*c:\websymbols*https://msdl.microsoft.com/download/symbols
and then click OK.
And that’s it for the symbol files. We’ve just saved a lot of time and effort by asking the debugger to look online for the symbol files instead of downloading them all. Let’s continue on to analyzing the dump file to find out which driver or application caused this crash.
Analyzing the Dump File
To start analyzing the dump file, in WinDbg, select File → Open Crash Dump. Navigate to your recovered dump file’s folder, high-light it, and click “Open.” A dialog will appear asking if you want to “Save information for workspace?” Click “Yes.”
This will open a command-prompt window showing the debugger running. Notice the prompt flashing at the bottom of the window. The first part will show (for Vista Service Pack 1):
Symbol search path is: SRV*c:\websymbols*https://msdl.microsoft.com/download/symbols
Executable search path is:
Windows Server 2008/Windows Vista Kernel Version 6001 (Service Pack 1) MP (2 procs) Free x86 compatible
Product: WinNt, suite: TerminalServer SingleUserTS
Built by: 6001.18063.x86fre.vistasp1_gdr.080425-1930
Machine Name:
Kernel base = 0x84c07000 PsLoadedModuleList = 0x84d1ec70
Debug session time: Wed Oct 1 15:04:34.437 2008 (GMT-4)
System Uptime: 0 days 6:05:14.028
Loading Kernel Symbols
Loading User Symbols
This tells us that the debugger was sucessful in downloading the symbol files from the server.
You’ll see a blue link that says “’!analyze -v’ to get detailed debugging information. You can enter
!analyze -v
at the command-prompt or simply click the blue link to continue. A new section called “Bugcheck Analysis” will then appear. Mine started with:
DRIVER_IRQL_NOT_LESS_OR_EQUAL (d1)
An attempt was made to access a pageable (or completely invalid) address at an interrupt request level (IRQL) that is too high. This is usually caused by drivers using improper addresses.
And here’s the problem that was found in this dump file.
SYMBOL_NAME: tdx!TdxEventReceiveMessagesTransportAddress+48e
MODULE_NAME: tdx
IMAGE_NAME: tdx.sys
DEBUG_FLR_IMAGE_TIMESTAMP: 479190ee
Followup: MachineOwner
The “MachineOwner” was set for “Followup.” Since the machine owner has little expertise in identifying driver problems, we went to Google and searched for “tdx!TdxEventReceiveMessagesTransportAddress+48e” and found some other folks talking about the same system stoppage and debug reports.
This particular problem happened on October 1, 2008. To Vista’s credit, it’s the last stoppage this PC has had.
I hope this article has helped you to identify the source of your blue screen of death, and I hope you’ll find the help that you need online to prevent a further recurrence. Thank you for visiting Bright Hub, and thank you for reading this article.


