Charts add visual interest and provide data in a way that is easily comprehended. While Excel is likely your first thought when it comes to making charts, this article will show you how to make charts right in an Access form or report.
Overview
You have probably made a chart or two (or a hundred) in Excel. Charts are not only helpful in a worksheet, though. Learn how you can create a chart to display data in an Access report or form, as well.
Charts in Microsoft Access
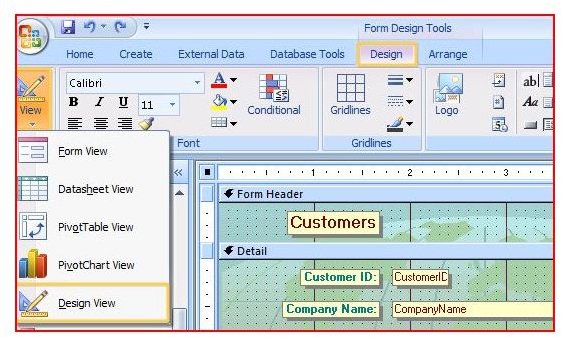
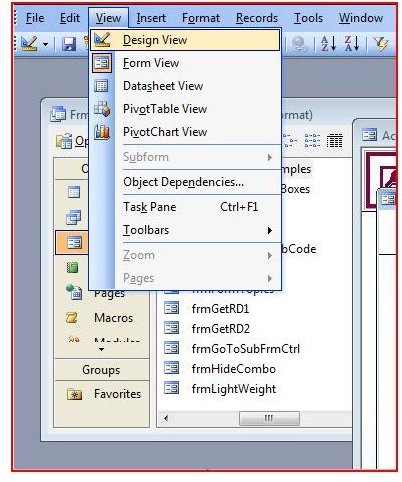
To create a new chart in Microsoft Access, open an existing Access form or report in Design View. To do this in Access 2003 or earlier, go to the View menu and select Design. In Access 2007, go to the Design tab, click the View drop down arrow and then click on Design View.
In Access 2003 or earlier, go to the Insert menu and click on Chart. (As an aside, if you find yourself frequently making charts in Access you might want to add a Chart button to the toolbar. To do so, right click the toolbar onto which you want to place the Chart button and click Customize. Go to the Commands tab and select Toolbox in the Categories box. Find the Chart button and drag it to the toolbar.)
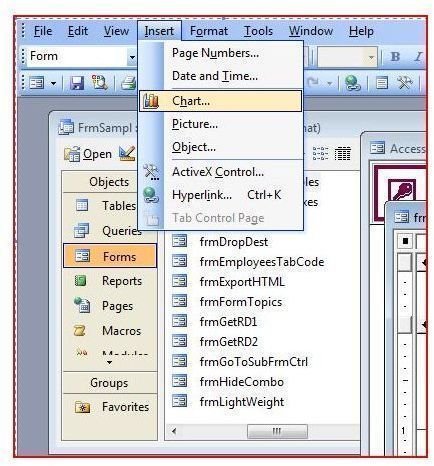
After clicking on Chart, move your cursor over the form or report. You will notice the cursor now appears as a little, black and white chart. Click on the Access form or report where you want to place the chart and the Chart Wizard will open.
If you are using Access 2007, go to the Design tab. You will find the Chart button in the Controls group. Click the Chart button and then click onto your form or report where you want to create a chart. The Chart Wizard will open.
Select an option under Which Table or Query Would You Like to Use to Create Your Chart and click Next. Under Which Fields Contain the Data You Want for the Chart? click on the field or fields you wish to use and then click the right arrow to add that field to the Fields for Chart box. When you have added all of the fields you wish to use, click Next.
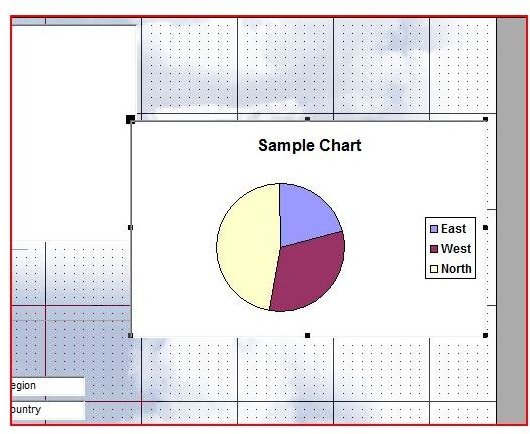
Select the type of chart you want to use in your Access form or report, and then click Next again. Drag and drop field buttons into the Data, Series and Axis boxes to define how you want the chart laid out and click Next. Make final changes and click Next again. Name the chart, choose whether or not to add a legend, and click Finish.
For more tips and tricks, be sure to take a look at the other items in Bright Hub’s collection of Microsoft Access tutorials and user guides. Learn how to create a crosstab query , find tips for optimizing Access databases , and more. New topics are being added on a regular basis so be sure to check back often.


