PowerPoint and Excel might not seem like they have much in common. However, these two Office applications are both used as visual aids, and they can both use charts. This tutorial will show you how to incorporate charts, with or without using Excel, into your PowerPoint presentations.
Charts and PowerPoint
Before using a chart in your next PowerPoint presentation, consider whether you already have an exis ting chart in Excel that provides the data you wish to present. If not, you can create a chart from scratch using PowerPoint.
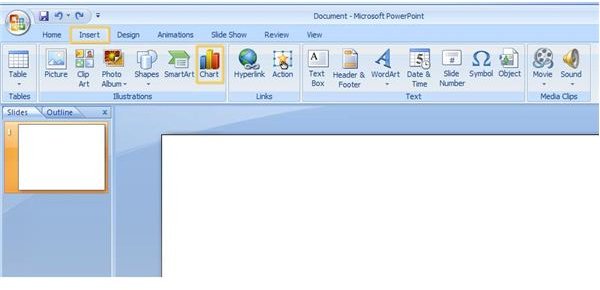
If you are using PowerPoint 2007, go to the Insert tab of the ribbon and click the Chart button. The Insert Chart dialog will open. Click the type of chart you want on your PowerPoint slide from the task pan on the left of the dialog box, and choose the specific chart you want to use from the gallery presented. A chart with sample data will appear on the PowerPoint slide.
If you are using PowerPoint 2003 or earlier, go to the Insert toolbar and click Chart. A sample column chart will appear on the PowerPoint slide. To choose a different chart type or style, right click the chart area and select Chart Type. In the Chart Type dialog, you can select a different type and subtype.
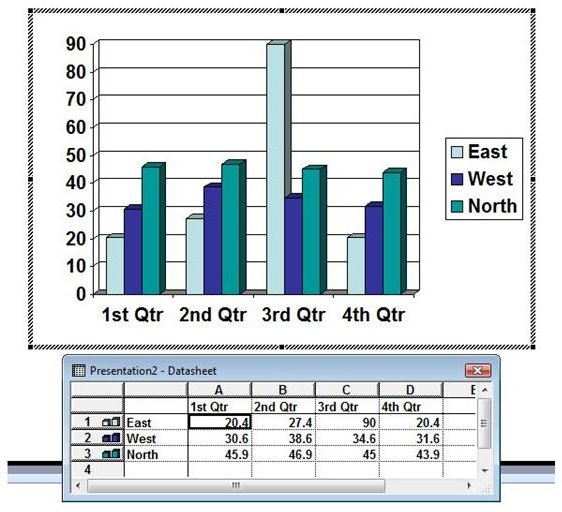
In either version of PowerPoint, a datasheet will open as well. This sheet will contain the data in the sample chart, and may or may not be in an Excel window (this depends on the version of PowerPoint you are using, as well as whether or not you have Excel). Enter the information you want to present into this datasheet. The chart will automatically update. When you are finished manipulating this data, close the datasheet.
If you have an existing Excel chart that you want to use in a PowerPoint, there are more than a couple of ways to get the chart to the slide. We will go over the two simplest ways.
If the chart is exactly as you want it, and you will not ever want to make any changes to it, simply copy the chart from Excel and paste it on your PowerPoint slide. To copy a chart, click on the outer area of the chart page to make it active. Select Copy from the Clipboard section of the Home tab in Excel 2007, from the Edit menu in Excel 2003, or use the Ctrl+C keyboard shortcut in either version. (Right clicking won’t work.) Click on the slide and paste away. The chart will appear as a graphic on your PowerPoint slide.
If you want to use an existing Excel chart in your PowerPoint presentation, but you want the ability to manipulate it, copy the chart just as in the previous step. Don’t paste it onto the slide in the typical fashion, though. In PowerPoint 2007, click on the Paste dropdown button and choose Paste Special. In PowerPoint 2003, Paste Special is on the Edit menu. Select Microsoft Office Excel Worksheet Object and click OK.
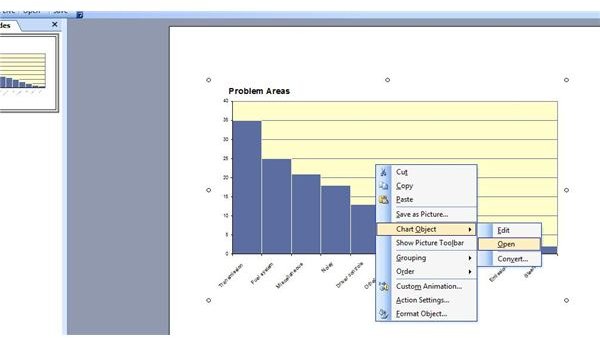
To make changes to the chart from PowerPoint, right click it, point to Chart Object and click Open. The chart will open in a datasheet or Excel, allowing you to make the changes you want.
For more tips and tricks, be sure to browse through Bright Hub’s collection of PowerPoint user guides .


