Having trouble inserting your Excel chart to a PowerPoint slide? In this article, we’ll guide you through the process step-by-step and give some tips to help make sure that the object doesn’t get distorted during the move.
Excel Charts in PowerPoint
One of the biggest problems that people have when adding a Microsoft Excel 2007 chart to a PowerPoint slide is that the chart will become distorted during the process. The best way to overcome this is to make sure that the chart is properly formatted in Excel before you attempt to copy and paste it into PowerPoint. In this guide, we’ll walk through the steps, from start to finish, for inserting an Excel chart into a blank PowerPoint slide.
How to Copy a Chart to PowerPoint
Step 1: Open both the Excel file containing the chart and the PowerPoint presentation to which you want to add the chart.
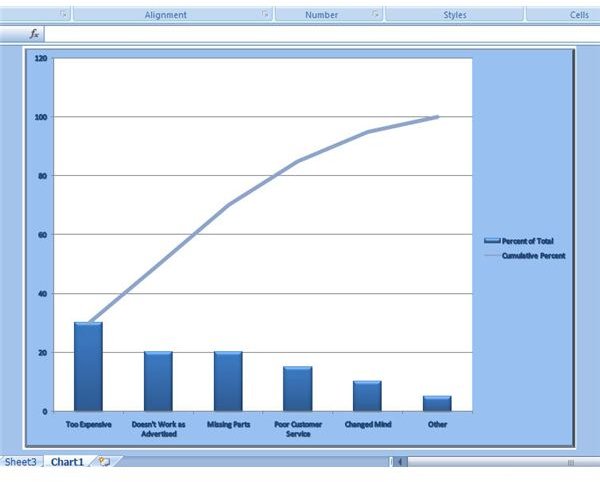
Step 2: Make sure that your Excel chart has been moved to its own worksheet and is the only object in that worksheet. If it’s not, refer to Part 2 of this series for instructions on how to move a chart in Excel. (Click the image for a larger view.)
Before continuing, make any format or design changes to the chart while still in Excel.
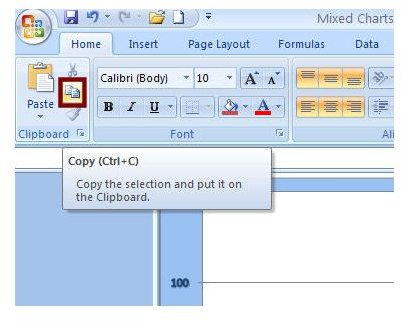
Step 3: Select the chart in Excel and then open the Home tab on the Excel ribbon. Click on the Copy icon in the Clipboard section. Alternatively, after selecting the chart, you can use the CTRL + C keyboard shortcut to copy the object.
Step 4: Switch over to PowerPoint, and navigate to the slide where you wish to insert the chart. If you haven’t created the slide yet, do that now.
Step 5: Open the Home tab on the PowerPoint ribbon. Click on the down arrow underneath Paste in the Clipboard section of the ribbon. Select Paste Special.

Step 6: In the Paste Special window that appears, make sure the radio button next to Paste is filled in, and then select the option to paste as a Microsoft Office Graphic Object.
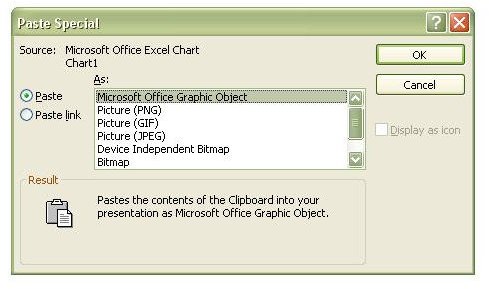
Step 7: Click OK when finished, and the chart will now appear on the PowerPoint slide as shown in the screenshot below.
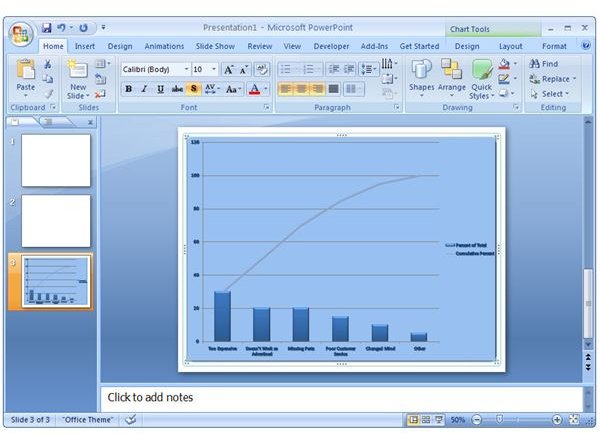
Tip: If you do decide that you want to modify the chart further after placing it in a PowerPoint slide, select the chart and the Design, Layout, and Format tools will appear under Chart Tools on the PowerPoint ribbon. You can then make design changes just as you would for any other chart.
Be sure to check out the other articles on Bright Hub’s Windows Channel for more Excel tips and PowerPoint tutorials .
This post is part of the series: Tips and Tricks for Working with Charts in Microsoft Excel 2007
This collection of articles is dedicated to exploring the many tips and tricks that can greatly enhance the power of charts in Microsoft Excel 2007.


