By default, a newly created chart in Microsoft Excel 2007 is placed in the same worksheet as the data used to create it. In this article, we’ll show how to move that chart to a different worksheet, either a pre-existing one or a brand new one created especially for that object.
Placement of Charts in Microsoft Excel 2007
When you create a new chart in Microsoft Excel 2007 , the object appears in the same worksheet as your original data selection. If you want to move the chart to a different location in that same sheet, you can do so by clicking on the item and dragging it to the new spot. However, if you want to move the chart to a completely different worksheet, either a pre-existing one or a new one entirely, you’ll have to take a different approach.
How to Move a Chart
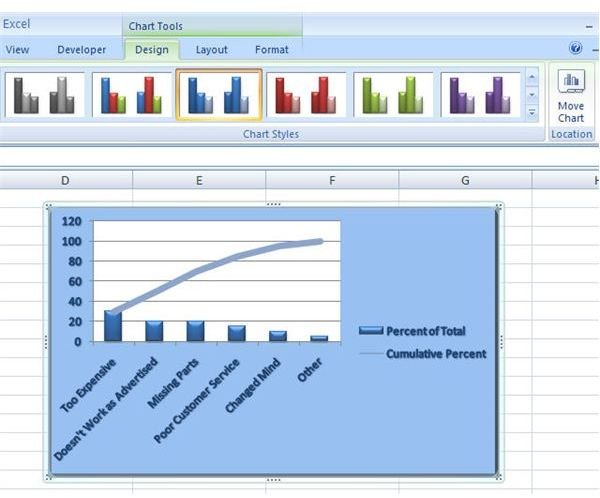
Step 1: Select the chart that you want to move. Open the Design tab under Chart Tools on the Excel ribbon. (Click the image below for a larger view.)
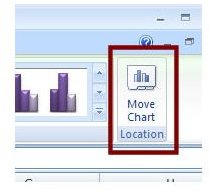
Step 2: Click on the Move Chart button.
Step 3: In the Move Chart window that appears, you will have two options. You can either move the chart to an existing spreadsheet listed in the dropdown box located next to Object in, or you can create an entirely new worksheet by choosing the New Sheet option.
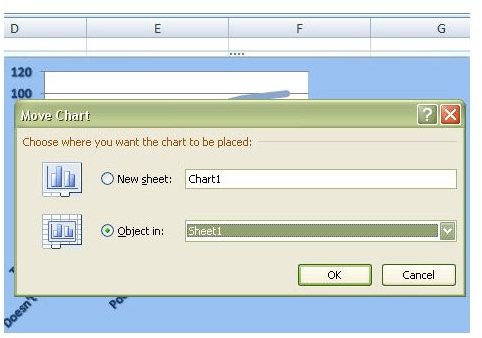
If you choose to move the chart to an existing spreadsheet, it will maintain the same size as it has in the current sheet. However, if you choose to create a new worksheet to place the object in, the chart will take up the full worksheet. This latter option is usually the best selection if you want to display the chart in a slide or as some other major exhibit in another Microsoft Office application.
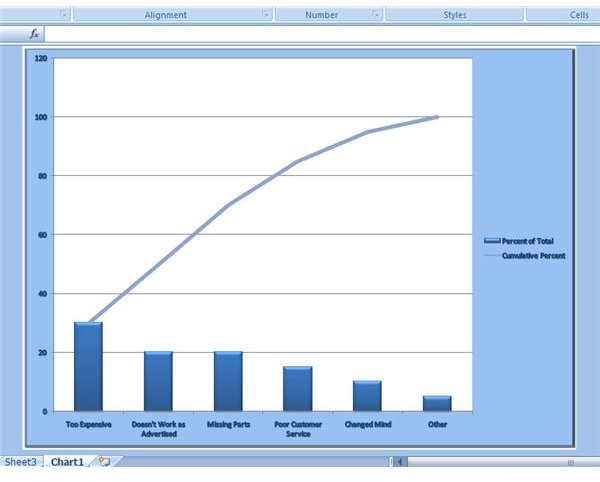
Step 4: Click OK to continue. The chart will now appear in the designated worksheet. In this example, we picked the New Sheet option in Step 3, and the results are shown in the screenshot below.
Tip: If you pick the option to move the chart to a new worksheet, the chart will be resized to fit the visible space in that sheet. As a result, some of your formatting, such as font size, may no longer have the desired visual effect you were trying to achieve. You can modify the formatting in this “full screen” sheet in the same manner you would any other worksheet. Select the chart and the tabs under Chart Tools will appear in the Excel ribbon, ready for use.
For more tips and tricks, be sure to browse through the other Microsoft Excel tutorials found here on Bright Hub’s Windows Channel.
This post is part of the series: Tips and Tricks for Working with Charts in Microsoft Excel 2007
This collection of articles is dedicated to exploring the many tips and tricks that can greatly enhance the power of charts in Microsoft Excel 2007.


