Installing that shiny Linux distribution was only part of the work you have to do towards worry-free computing. Keeping it fit and lean is essential to having a long period of zero-maintenance computing. This article will ensure that you keep your computer fighting fit and ready to take on anything!
Introduction
You finally decided to ditch Windows once-and-for-all, and took the leap into the exciting-but-scary world of Linux. And after reading tens of how-tos, you seemed to have found your footing in Linux and want to try new stuff. But hold on! Before you go around installing 7 different media players, 4 different browsers and switching between desktop environments just for kicks, you’d do well to install a few small applications which will ensure that you keep your computer fit and ready to take on anything you decide to throw at it. Monitoring your hardware is always an investment, but it keeps rewarding you for your proactive behavior day-after-day. This includes, but is not limited to keeping your hardware running at an optimum temperature, turning on power-saving modes on your computer and keeping your disks free of junk.
Over the next few paragraphs, you will learn a few valuable tricks to make the most of your current hardware setup.
Power Saving
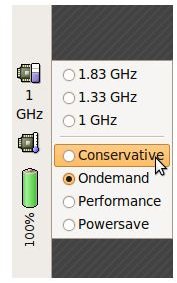
Longer battery life while on-the-move, lower temperatures when not demanding full performance from your computer and prolonging the life of your hardware are just some of the advantages of using the power-saving modes available for your hardware. The “powernowd” service in Linux interacts with the cpufreq kernel driver to govern the processor power-saving mode. You will have heard of AMD’s Cool n’ Quiet or Intel’s SpeedStep technology. You can customize the level of power-saving through the governors/preset modes which are available from the kernel:
**
Ondemand- This setting will use the upper and lower limits of your processor’s clock speed and fluctuate between them as per your performance needs. So a simple card game will not push your processor beyond it’s lowest clock-speed, ensuring that your hardware is using minimum power. Fire up a 3D game and watch the CPU frequency jump to its highest possible value, and use maximum power.
Conservative- This is just like Ondemand, but it’s conservative at shifting up a higher gear during demanding loads.
Performance- Fastest speed and highest power consumption.
Powersave- Lowest speed and least power consumption.
On most modern distributions, the kernel has the CPUfreq driver built into it, so simply running the powernowd service is enough to turn on the power-saving mode. If your distro doesn’t have powernowd installed (Ubuntu 8.10 does), refer to its documentation to know how to install the service and run it at boot-time. For people who build their own custom kernels, make sure to select cpufreq during kernel configuration and include it as a built-in driver rather than a module.
Monitoring temperatures
CPU: As the processor temperature keeps increasing, for every degree, its life keeps getting shortened by the heat. Therefore, making sure that your CPU is running within a safe temperature range is of utmost importance. Again, most modern distros will bundle in some form of driver which will interact with the temperature sensors placed inside the hardware. There are various methods of tapping into the information provided by the sensors.
If you have a modern ACPI-compatible system, and chances are that you do, you will be able to monitor your CPU temperature easily. Typing “acpi -t” in the command line will give you the processor temperature. If you get an error saying that the device is not supported, you most probably have an incompatible motherboard.
In such cases, lm_sensors comes to the rescue. lm_sensors is the de facto hardware monitoring tool for Linux. It’s capable of monitoring most, if not all the sensors present in your computer to give you a complete picture of how your machine is working. Again, your specific distro’s package manager will come to the rescue.
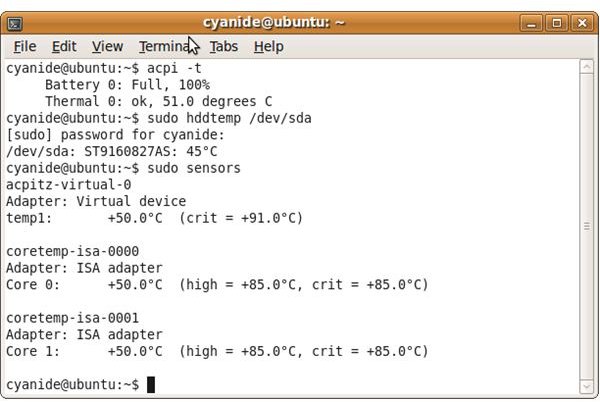
Hard-Disk: The hddtemp service will give you your hard-disks’ temperatures through the SMART functionality found on all drives today. All you have to do is install the service if it’s missing and run it. It will run in the background and monitor your disk temperatures. To check the temperature, a simple “sudo hddtemp /dev/xDy” (where x can be h or s, and y is an alphabet. for example, /dev/sda or /dev/hda) will suffice.
Motherboard, graphics card, etc: lm_sensors to the rescue here. Just make sure you have I2C support in the kernel; Hardware Monitoring support and relevant hardware monitoring drivers compiled as modules. Once installed, a simple “sudo sensors” will give you the information you need.
Frontends: Chances are, you are using a graphical interface everyday and you would rather have the information presented to you in a shiny application rather than the boring command-line. And luckily, graphical frontends for these sensor applications are available by the hundreds; from a simple Gnome panel applet to full-blown remote-monitoring applications. Personally, I use the computertemp Gnome applet which sits in a panel and taps into all available sensors. For a much bigger list, make your way here and scroll down to the Hardware monitoring applications using the lm_sensors package section
Fan speeds
Now that you’ve hopefully turned on power-saving modes on your machine and know what temperatures it’s running at, another good suggestion would be to install a couple of packages which will allow you to control the fan speeds of your processor’s heatsink-fan. This ability will allow you to manually lower or increase the fan speed as per your performance needs, whether it’s a simple coding job in a text editor or playing a high-def movie.
pwmconfig: It gets installed with lm_sensors and is used to find out which sensors have pulse-width-modulation controls. It attempts to stop the fan for a few seconds and checks if it results in higher temperature on that sensor. As a result, it will now have information on all the user-controllable fans in the system. This information will be stored in a text file which will be read by fancontrol.
fancontrol: Now, all you need to do is run “fancontrol [name_of_config_file]”. Fancontrol will read the sensor/fan data from the above-created config file and automatically modulate the fan-speeds as per the current temperature of the CPU. You can edit this config file and change a few variables like “MINTEMP”, “MAXTEMP” to set your own preferred options. These will set the speeds at which the fan gets activated.
Disk usage
With growing disk sizes for paltry amounts, you don’t really need to watch for wastage of disk space. But it’s good practice to know where and what is eating up all that space. Here, I cannot recommend anything other than JDiskReport. It’s a completely free cross-platform (Windows, Mac, Linux) application which scans a specified folder tree and lays the info out in pie-charts and graphs. You can then save these scans and refer to them after you’ve cleaned up useless junk from your system to compare the differences.
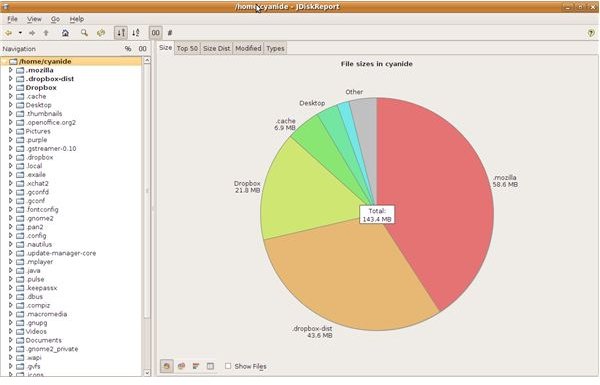
Since it’s a Java application, you need to first install Sun Java 6.x using your distro’s package manager. Once done, download JDiskReport Java version from here and extract the zip file wherever you’re comfortable with it. It doesn’t need to be installed. Now, just open up a terminal window, navigate to the JDiskReport folder and type “java -jar jdiskreport-x.y.z.jar” (Where x.y.z is the version you’ve downloaded.) Accept the license and point it to a folder tree to scan it. Remember that you might need permissions if you want to scan any folders other than your own. Try “sudo java -jar jdiskreport-x.y.z.jar”. Feel free to play around with the different charts and graphs to get a complete picture of your disk usage.
Use this information to learn where you’re losing unnecessary space and clean it. With enough proficiency in Linux, you should be able to understand what each folder stores and be able to clean the junk without harming other files. Make sure you know what you’re cleaning/deleting before you actually do it.
Final Words
While not exhaustive, these tips and applications will make sure that you’re well on your way toward a trouble-free computing experience for a long time. Make sure to write in with other tips and your experiences; we’re waiting to hear from you!


