A good indicator of a country’s development is how much they spend on information and communication technologies. Here is a run down of data on how much some of the major countries of the world spend on IT!
Editor’s Note: This article was originally published in 2008. The data displayed may be out of date.
The importance of IT
Information Technology spending is an important indicator of current growth and prosperity of a country. Future infrastructure will be largely determined by the amount of money a country is spending on things like computers, cell phone, internet infrastructure, and other data transfer capabilities. To get a good sense of who is spending what, here is a run down of the data on information technology spending by country.
Source of Data
Finding the data can be somewhat difficult. A lot of reports cost a lot of money since they are conducted by large marketing firms. However, there is a good set of data over at the World Bank website. To get a good sense of what people are spending there are three sets of data you can look at: the total IT expenditure, the % of the GDP that this expenditure makes up, and the IT expenditure per capita.
The best way to look around this data is to go to the World Bank’s database . There you can select what factors you want to look at over a set of times and for a set of countries. The most recent data they have is 2009s currently but they seem to keep it up to date. The data below is from this.
Total IT Expenditures
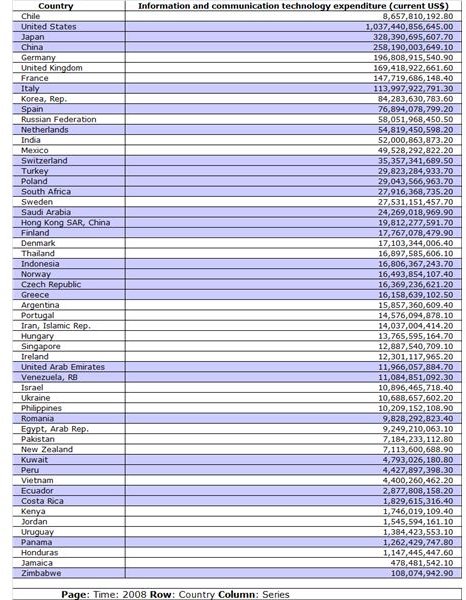
Below is a simple chart showing all of the total IT Expenditures for major countries with data for 2008 as well as a bar graph showing the expenditures.
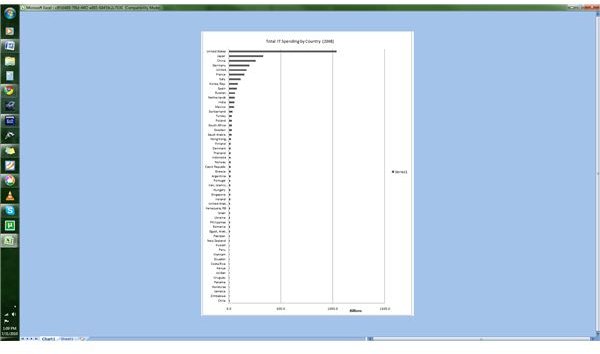
As you can see, the USA spends a great deal more than any other country; The US spends over a trillion dollars a year on information and communication technologies. The next down is Japan who only spends $300 billion. Of course this spending declines dramatically from there as well, plummeting to small values for lesser developed countries.
IT Expenditures as a % Of GDP
Here is a chart and a graph showing what percentage of the country’s GDP is spent on information and communication technology expenditures. Again, data is from 2008.
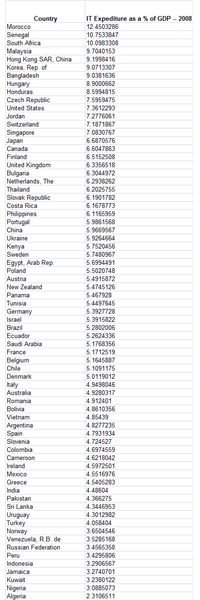
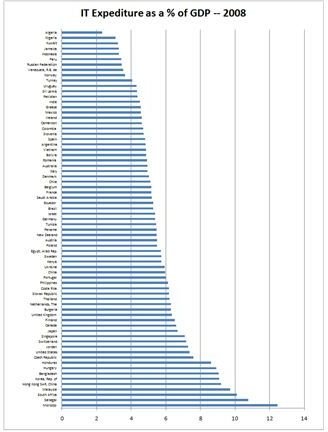
This data shows a slightly different picture of the IT spending. As you can see, a lot of countries that are low on total IT expenditures actually spend a huge percentage of their money on them. The top four are countries you wouldn’t expect: Morocco, Senegal, South Africa, and Malaysia. This shows a strong emphasis in building infrastructure that will definitely benefit these countries in the future.
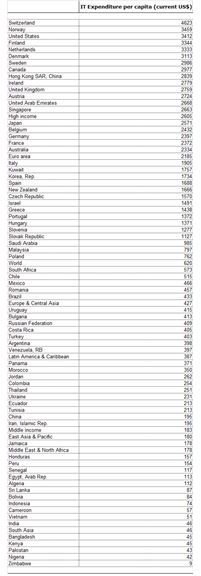
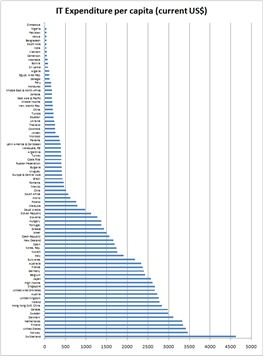
It Spending Per Capita
This chart and graph show the IT expenditure per capita in current US dollars. Again, this shows the data a little differently; it shows how much every individual in that country is able to spend on their information needs. Here we see Switzerland and Norway at the top with lesser developed countries falling at the bottom. It is interesting to note that Switzerland is far ahead of anyone else, with over a thousand more dollars to spend per person.
This article has been placed in our archives.


