The Sun. It gives us light, warmth, life. In ancient times it was worshiped as a god for just these reasons. But it holds many mysteries, such as sunspots, its coronal temperature and hemispheric discrepancies that even today, with our robot spacecraft spying on its activity, we have yet to answer.
Why do Sunspots Occur in an 11 Year Cycle?
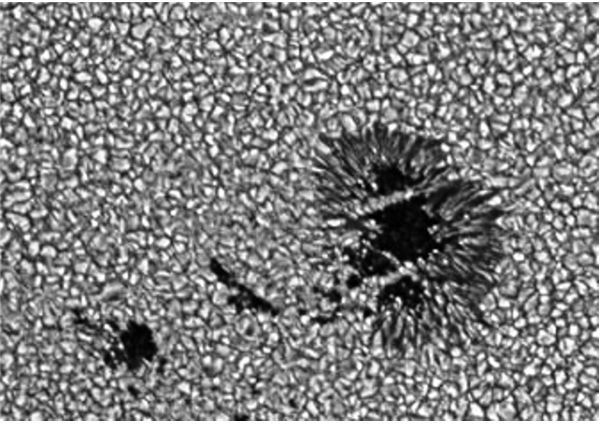
One of the first mysteries early astronomers noticed about the Sun were strange dark spots on its surface that moved across it. They were dubbed sunspots because they were darker than the normal solar surface.
As telescopes and observational techniques became more sophisticated, these were seen to be areas where material was not welling up from the interior. By mid-19th century, astronomers realized they were darker because they were cooler than the surrounding material. What was preventing the normal movement of material from the interior to the surface?
Detailed study indicated sunspots appeared to exhibit the same form as magnetic lines of force seen when a magnet is brought near
iron filings. By the 20th century, astronomers were certain sunspots were areas of intense magnetic fields. It was the high magnetic force that kept the material in the Sun’s interior from migrating to the surface.
But even early observations found a unique aspect of sunspots. They developed in an 11 year cycle. Every 11 years they would reach a maximum, then decline to a minimum, then begin a climb to a maximum again.
In recent years, with our robot spacecraft and observations from Skylab and the ISS, we have found another unique aspect of sunspots…they occur in pairs. One spot is a north magnetic pole, the other is a south magnetic pole.
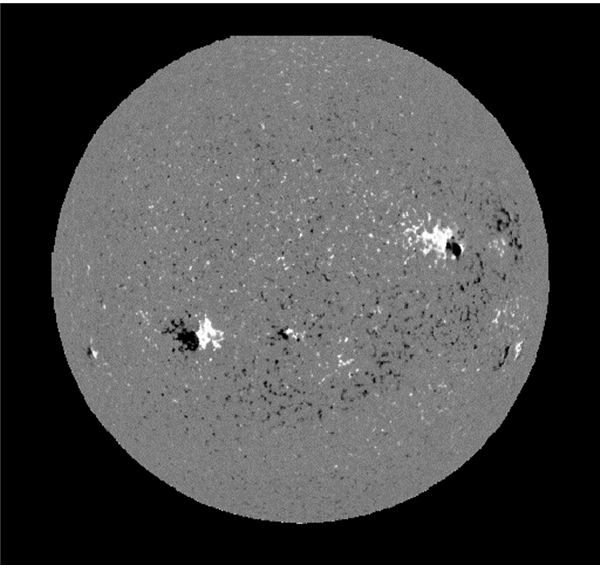
And the 11 year cycle actually becomes a 22 year cycle when this is factored in. As the sunspots reach their minimum and begin another maximum, those left over from the previous maximum reverse their polarity. The north pole becomes a south pole and vice versa.
What causes this strange behavior? Why do the sunspots occur at such a regular interval? Our spacecraft will have to give us more data before we can develop a viable theory.
Do Sunspots Affect Earth’s Climate?
During sunspot maximums, solar radiation increases a small percentage. However, ultraviolet radiation increases significantly, and solar flare activity, which is generated in the regions between spots, increases greatly. Flares are extremely hot ejections of plasma.
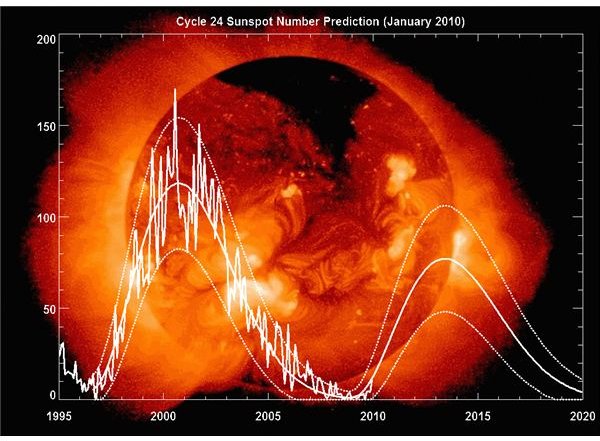
We have just come out of sunspot maximum 23 (beginning counting in 1749), which peaked in 2000 with 170 spots a day—a highly active cycle. It was during this time that ‘Global Warming’ became a rallying cry for environmentalists. We are now in the minimum part of the cycle. (See the NASA prediction graph below.)
This year, China saw its’ coldest winter in 40 years, Florida the coldest in 30 years. Europe experienced the coldest winter in 25 years—all this according to ABC News.
But there is another clue that sunspots may have an affect on our climate. In that count of sunspot maximums, there is a period between 1645 to 1715 when sunspots were almost nonexistent (sunspots were being counted then but not on a daily basis as was begun in 1749). This is known as the Maunder Minimum.
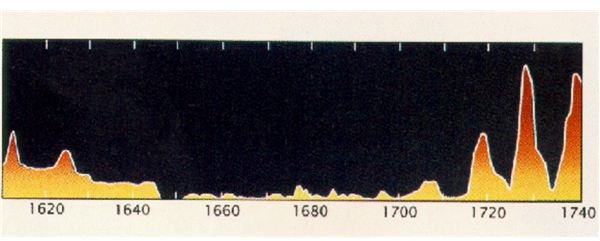
During these 70 years, the Earth was cast into what’s called the ‘Little Ice Age.’ Global average temperatures dropped more than two degrees F. Are such minimums the cause of the major ice ages Earth has experienced in its geologic past?
NASA predicts the next sunspot maximum (24) will occur in 2014, but that it will be considerably weaker than 23. Could this foretell a cooler climate?
To be fair and balanced, there is no overwhelming evidence that sunspots are the gremlins of Earth’s climate. Many other factors could enter the equation. For example, our planet wobbles on its axis. Its average tilt is 23.5 degrees, but over a period of 18.6 years that varies from 22 degrees to 24.5 degrees. That changes the amount of solar radiation that each hemisphere receives.Then there are El Nino and La Nina.
Perhaps they all make their own mischief. Let’s consider more mysteries of the sun in the next section.
Hot Air
The Sun is a complex mechanism. Twenty-five percent of it consists of the core which is at a temperature of an amazing 27 million degrees F. This is where the hydrogen is fused into helium and the Sun’s energy is generated. Above this is a radiative zone within which x-rays, over a million years, gradually make their way to the surface.
Above the radiative zone is the convective zone. It is here that solar astronomers believe the massive magnetic fields that create sunspots are generated. Material from this zone, which is at a temperature of two million degrees F, bubbles up to the surface, called the Photosphere. Here, the material cools to about 11,000 degrees F and sinks back to the convective zone.
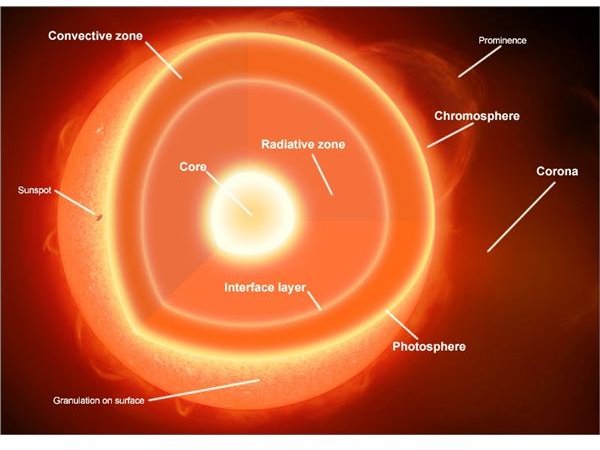
Above this is the Chromosphere, the lower layer of the Sun’s atmosphere, and here something strange happens. In normal situations, a body’s surface is warmer than its atmosphere. Not so on the Sun. The temperature in the Chromosphere ranges from 11,000 degrees F at the surface to 36,000 degrees F at its height.
But that is nothing compared to the outer layer of the atmosphere, called the Corona. Here the temperature is one million degrees F or more. Astronomers are baffled by this phenomenon. As you move into the upper regions of the solar atmosphere, the gases become more tenuous and so should be cooler. But they just keep getting hotter. Some think it may be due to heating by the Sun’s magnetic field. Others think it may be due to density waves pulsing from the inner layers.
Bernard Fleck, project scientist for the SOHO spacecraft, is now gathering data from the Sun and says he thinks it may be a combination of both.
It is just one more of the mysteries the Sun holds for future exploration.
Hemispheric Heat Discrepancies
The solar probe, Ulysses, gave us unique views of the Sun for 20 years. The venerable spacecraft is now in its last days, but it uncovered more mysteries for astronomers to ponder. In a solar polar orbit, Ulysses found there were holes in the Corona at the poles. These holes are caused by the Sun’s magnetic field looping back into the poles. Huge jets of gas, plasma and radiation shoot out from these holes.
But that is not the most puzzling discovery Ulysses made. The space probe found that the Sun’s south pole is 145,000 degrees F cooler than the north pole. At first astronomers thought this might be due to the fact that the Sun’s magnetic field flips every 11 years (the same cycle as sunspots!). But that proved not to be the case. The temperature discrepancy remained whatever the orientation of the magnetic field.
That would have to mean there is some difference in the very structure of the Sun’s two hemispheres. How can that be? That mystery may be a long time away from being solved.