Adding Charts to InDesign Publications: Quick & Easy Tips
Build Charts for InDesign with Excel
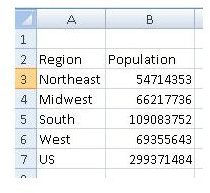
Because Adobe InDesign does not have a native capability for creating charts, using Microsoft Excel to create the charts is often a good solution. To create a chart, you must first open Microsoft Excel and create a table to serve as a source for your chart.
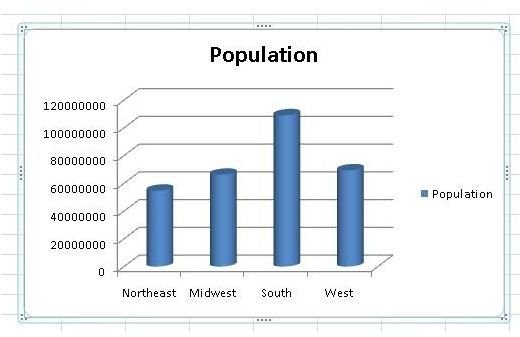
From your table, create a Microsoft Excel chart.
You can now copy your chart from Microsoft Excel and then paste it onto your InDesign layout. You can do the same thing with your Microsoft Excel table if you wish.
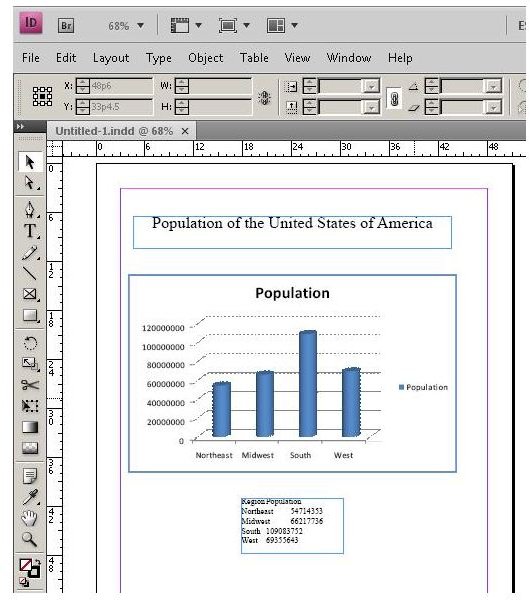
You have now learned how easily with charts InDesign can come alive using the powerful tools Microsoft Excel brings to the table.
Using the Claquos InDesign Script
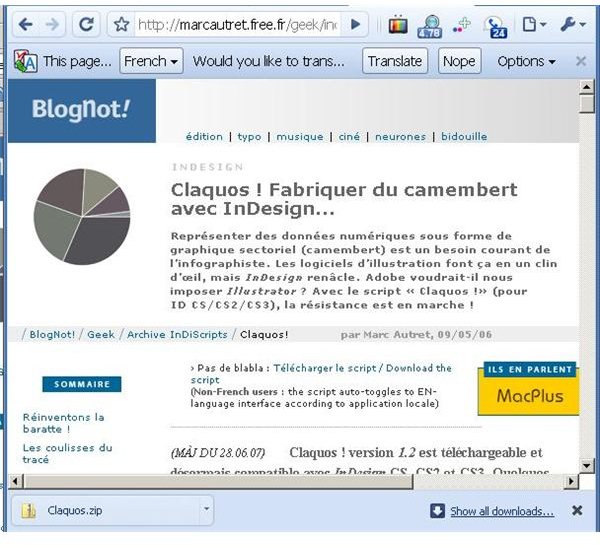
An InDesign script can be used to create charts in Adobe InDesign. Claquos, a free script for creating charts InDesign can use, is downloadable from the Claquos Web site. The site happens to be in French, so if you are a bit sketchy with that language, you may want to use Google translation tools to translate it into a more familiar language. In the screenshot below, you will see that Google translation tools appear at the top of the page when using the Google Chrome Web browser.
Getting the Claquos Script
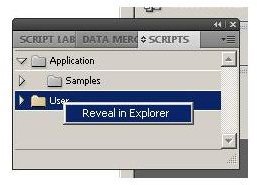
Click the download link to get the Claquos script. After downloading the file, copy it to the clipboard and then paste it into your InDesign user scripts folder. To gain easy access to your scripts folder, click “Window” on the main menu and then choose “Automation” and then “Scripts.” Right click on the “User” folder and then click the “Reveal in Explorer” option.
Next, double click the “Scripts Panel” folder to enter it and then right click and select “Paste” from the context menu to place the Claquos script into the folder. Close Windows Explorer and then you will see that Claquos now appears in your scripts window.
Using the Claquos Script
In the “Scripts” window, double click “Claquos.js.” In the Claquos window that appears, type the series of numbers you wish to use for your chart with spaces separating each value. You can also fill in the “Graphic’s dadius” field to define the size of your chart.
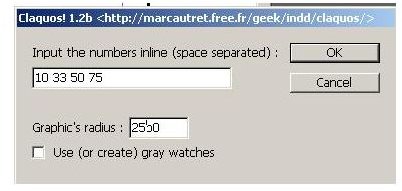
Now, click the “OK” button to create your chart.
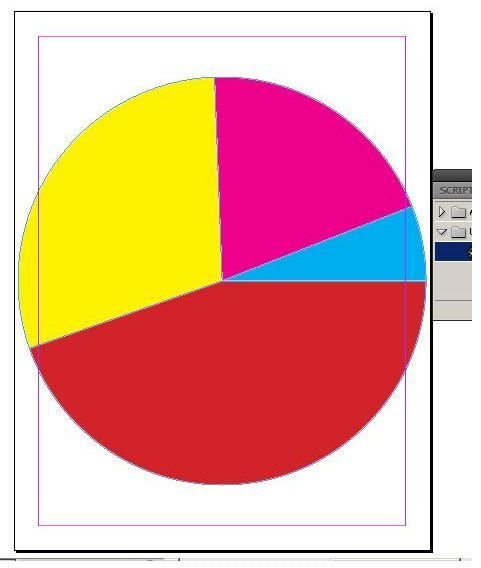
You now have a chart InDesign can use in your layout. You can resize your chart as necessary by clicking on it with the “Selection” tool and then using the InDesign sizing handles.
InDesign Charts Wrap Up
This InDesign tutorial introduced you to two powerful methods for creating charts InDesign will embed in your layout. You may want to stay familiar with both methods so you have options available to you every time you need to create charts in Adobe InDesign.
Image Credits: Screenshots taken by Bruce Tyson