How to Calculate and Use Pivot Point Trading Strategies in the Stock, Commodities and Forex Trading Markets
Using Pivot Points
Support and resistance levels represent points in the market where the price action is expected to stall, pause, change direction, or build a base for a big move. There are many methods that day traders use to determine these levels, but one of the most popular and powerful is using the pivot point technical indicator.
Pivot points can also be used to identify entry points and key levels that need to be broken before a move qualifies as a breakout. They are also known as a rotation points, because the direction of the market can be determined based on where the price action is, in relation to pivot line. If the price action is above the pivot point, the market is said to be bullish, and bearish if the price action is below the line.
Calculating Pivot Points
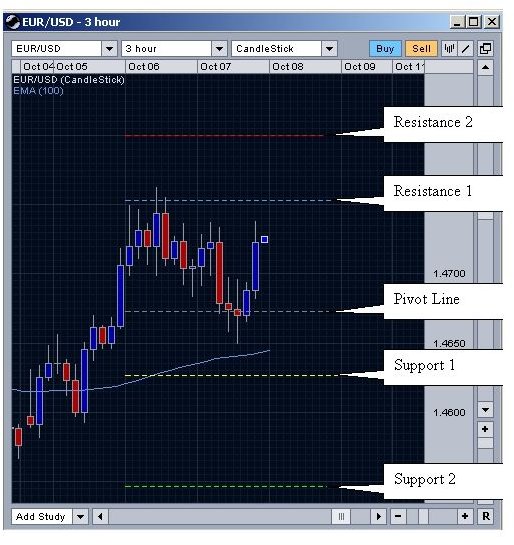
Pivot points are comprised of five lines: a pivot line, two support lines (S1 and S2), and two resistance lines (R1 and R2). See Figure 1 below. By definition, a pivot line is a technical indicator that is derived from calculating the numerical average of the previous period’s high, low and closing prices.
The most common method of applying pivot lines is to calculate them from the daily charts and then apply them to the intra-day charts (i.e. hourly, 30 minutes and 15 minutes). Even though they can be calculated from intra-day charts, doing so tends to reduce the accuracy and significance of the indicator.
The pivot lines can be calculated as follows:
Central Pivot Point (P) = (High + Low + Close) / 3
Support and resistance levels can then be calculated using the following formulas:
First level support and resistance:
First Resistance (R1) = (2*P) - Low
First Support (S1) = (2*P) - High
Second level of support and resistance:
Second Resistance (R2) = P + (R1-S1)
Second Support (S2) = P - (R1- S1)
Third and fourth levels can also be calculated using the model explained above, but these have little value to the trader, since the rest of the market itself places little value on them. Nevertheless, they can be used to track the midpoints of other major levels.
Figure 1 - Pivot Point, R1, R2, S1, S2 Levels
Pivot Point Trading Strategies
Breakouts tend to occur when the market opens. This often occurs as financial institutions, businesses, consumers, and speculators tend to place the largest orders at the start of the business day. The breakouts may also occur as traders review how the market traded in the previous session and adjust their portfolios. This is the reason why pivot points are ideal for trading range bound markets, such as Forex.
If properly applied, pivot point trading strategies will often give day traders a look into what the market’s trading range will be, and afford them an opportunity to properly forecast entry and exit targets, in addition to determining the market trend, significant support and resistance levels and, trend reversal points.
Continue on to the next page for more pivot point trading strategies.
Support and Resistance Levels - It is at the pivot levels that the largest price movement can be expected to occur. However, while price movements may pause at these levels, there is no guarantee that a support or resistance level will hold. In other words, they may, in essence, be just “bounce levels,” or points at which the market will pause before continuing the current move.
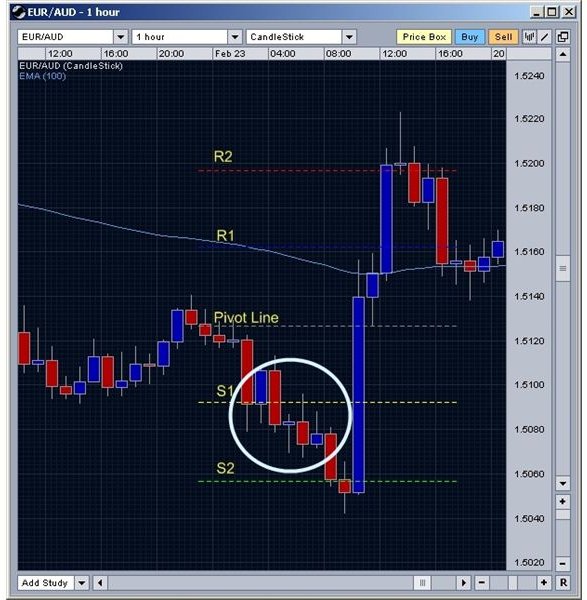
If prices drive through the pivot point, this is an indication that the pivot level is not very strong and the price move is likely to continue without respect for the afore breached level. In Figure 2, notice how the market stalls on the S1 level (shown by the circle), but the level later fails as prices move down to find support on S2. The move pass S1 was a valid breakout, because the market moved below it but tested the level (from below) before moving on to S2.
Figure 2 - Pivot Point Trading Strategies
Trend Determination – If the pivot line is broken by an upward movement, and/or remains above the line, then the market can be said to be bullish, if only in the short-term.
Trend Reversal - As with most strategies that use technical analysis, a pivot point trading strategy works best when it is used in collaboration with other indicators, or chart patterns. For example, Figure 1 (on the previous page) shows an engulfing reversal pattern occurring on the pivot line. The trade signal is further validated by the fact the pivot line is being respected by the market, as can be seen from the doji patterns that have formed on the pivot line.
Pitfalls to Avoid
Since this technical indicator is calculated based on the highs and lows of the previous days price movements, the support levels are usually valid for one trading session, after which, they must be recalculated. In essence, pivot points are best used to determine short-term support and resistance levels.
Forex traders should be aware that this technical indicator doesn’t work well when the previous day’s price range was comparatively narrow, such as:
- On a Sunday or on a Monday after light trading on the previous day. Automated pivot point calculations for Sunday are based on the highs and lows of Saturday’s trading, which tends to be flat can cause the Pivot lines to be inaccurate. To work around this problem use Friday’s, instead of Saturday’s, daily candle to calculate the pivot lines for Sunday. Regardless, the real test of a Pivot Points validity is the market’s reaction to it as a genuine support or resistance line.
- When a news release surprises the market. If the market had remained relatively flat in anticipation of a news release, and that news event causes a major price move, then the pivot lines will not be respected by the market because of how the compartatively large move affects chart patterns.
Summary
While pivot point trading strategies are ideal for range-bound markets such as Forex, they are a powerful addition to any day trader’s toolbox. Pivot points can be used to forecast support, resistance, profit and exit levels, long before the days trading gets underway. In fact, it is one of the few forward-looking technical indicators there is for trading the financial market.