
Although the current recession has significantly affected the stock market, there are still good opportunities for trading. In other words, the whole market has fallen, but according to the nature of their business, some stocks are still good for profitable trading, regardless of the recession.
Technical Analysis
The current economic recession is definitely an unfortunate event, but there are also some obscured facts about it.
Here is a simple analysis of the price chart for Wal-Mart Stores Inc. It is an old stock that trades on the NYSE with the symbol of WMT. Although Wal-Mat is subject to severe criticism due to some of the company’s policies and business practices, the company is quite successful in the financial markets. It is currently the world’s largest public corporation by revenue, as reported by 2008 Fortune Global 500 .
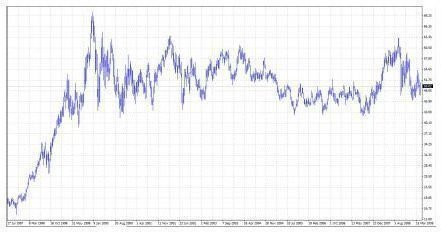
The price movement in the past 10 years is obvious even without an advanced mathematical analysis. The price from $20 in the beginning of 1998 rose to reach $70 in the end of 1999. In other words, the price had a 250% increase just during 2 years. This is a golden period for the stock market.
The stock’s price has regularly oscillated in a range between the highest price ($70) achieved in December 1999 and the lowest price ($42). By ignoring the temporary peak of December 1999, the so-called solid range is reduced to $42-62. Thus, the price fluctuations during the past 8 years were around the median $52 with 20% changes maximally.
The main feature of the current recession was its speed. In fact, the market was changed rapidly in a short period of time. Nevertheless, can you recognize the recession period on the Wal-Mart chart? Surprisingly, the price was almost above the $52 median during the worst days of the recession.

Wal-Mart Chart
Advice to Traders
Not all companies have been affected the same by the economic recession. However, people usually just glance at the stock market and see that Wal-Mart is also red and falling as well as others; but when just taking a look at the chart with a sufficiently long period of time, some other facts are revealed.
With the aid of such alternative perspectives, one can judge about the current recession in a more realistic manner, as professional economists do.
In fact, Wal-Mart is still a good stock for trading. Many traders are now waiting for the end of the global crisis to start recession-independent trades, as they believe possible unexpected events during the recession or even recovery period can lead them to bankruptcy. However, from a mathematical point of view, there are still some unaffected stocks, suitable for the so-called recession-independent trading.
Trading on Wal-Mart
As described above, Wal-Mart is a potential stock for trading during the economic recession, as traders can follow both short-term and long term strategies to trade Wal-Mart shares. The biggest fear for day traders (and general those who trade on a short term basis) is a sudden irreversible price change; although this is always a prossability, Wal-Mart has shown that it has historically wheathered various economic events well.
Consider long-term trades in WMT when the stock’s price in near the bottom of its recent historical range. The company’s overall stability and business model make it more likely to be one of the faster companies to take part in a recovery.
This post is part of the series: Technical Analysis of the Stock Market
In a series of articles, the price movement of various stocks in the course of a relatively long period of time is reviewed. The aim of this series is to reveal some hidden facts about the current situation and behavior of the stock market.


