How-to use Dalvik Debug Monitor Service (DDMS) Tool with Google Android
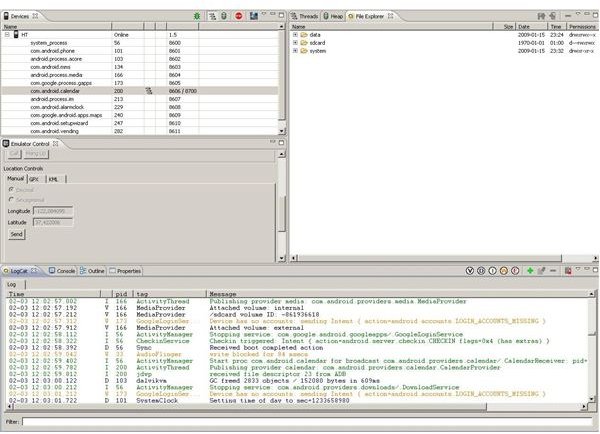
If we had installed the Eclipse plugging properly (if not, please go to “Setting the environment”), we could access to the DDMS perspective. On your Eclipse menu bar, click on “Window” and then on “Open Perspective”. Search for the DDMS perspective. We will see a screen like this one we have in the picture.
Now, lets have a look to all the elements we have here.
Devices
In the top left window we can see a tab with the label “Devices”. Here we can find all the devices/emulators that are “Online” and connected to Eclipse. Below each instance of the Emulator or device, we have all processes that are running in this instance, each process runs in its own Virtual Machine and we can identify them by the package name of the application it host. In the most-right column we find the ports where this VM are connected. And just in the left of the processes name, there is other number, this is the “Linux process ID”. Every Linux process has its own unique identification, as Android is based on Linux kernell, we find the same process systems here.
In this same window, we find some icons in the top side of it.
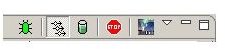
From left to right.
--The “bug” icon, represents the debugger state. If its green, we are connected to the debugger and we can do debugging task. If it is red, we are disconnected from the debugger.
--The multiple-rows icon, just activates the “threads visualization”, if we select a process and we click this icon, in the right panel, in the tab “Threads” we will see the info, state and actualization times of the threads running in this process.
--The bucket-like icon. Has more or less the same functionality than the “Update Threads” icon. In this case we update the heap memory usage of this process. Clicking on it we update this information in the right panel.
--The stop icon, is just as easy as, stop the selected process.
--And to finish talking about this icons, we find the “Get screenshot” icon, with this, we can have an instantaneous picture of our device/emulator screen.
Emulator Control
In this panel, we find some emulator options (this only works when we are working with the emulator, not with real devices). Here we can simulate incoming calls, SMS for testing purposes. We can set the “Location coordinates” (Latitude, Longitude) like a GPS.
Logs and ouputs
In my point of view this is the most important panel of DDMS. Here we can do debugging and tracing task, in case we have problems with our application.
In the “LogCat” tab, we have all messages from the device, most of them are incompressible, but here we can find Exceptions messages and Messages we add in the Android code using the Log.i(“Title”,”Message”) class to display “information” messages. If we want to display “Error” messages it would be something like Log.e(“Title Error”, “Error”).
In the “Console” tab, we find other kind of messages. This are related to the changes of states and applications in the phone. When a Application is installed, or when we start the device/emulator, messages showing that information will be displayed here. If we find connectivity problems, here will be shown this kind of errors too.
The Outline and Properties tab, shows information about the application: classes, attributes, variables…
File Explorer, Heap and Threads
In the last panel, we find three tabs, Threads, Heap and File Explorer. The Threads and Heap tabs are just the information displayed from the first panel when we check the “Update Threads” and “Update Heap” buttons.
Here the most important tab is the File Explorer. With this, we can access to the device/emulator file system, we can push files into it, get files from it and delete them (Using the top-right icons). At the right of the file names, we can find the last update date, and the permissions of this file/folder (Using Unix system, again)
One more step
With this tool we are one step nearest to create interesting and efficient applications!!
In next articles….more!
This post is part of the series: How to- Develop Applications on Android: One more step
In this second Serie of articles we will continue working on Android and Eclipse.This time, we will see different resources to make Android apps development more easy.