Explaining the Carbon Cycle with Diagrams and a Free Student Worksheet
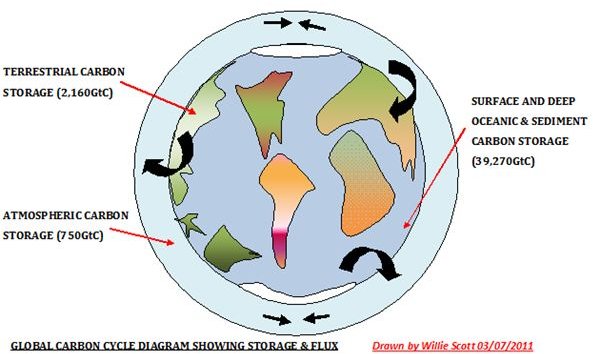
The carbon cycle is the continuous movement and storage of carbon through the earth’s land, sea, and atmosphere. Some of it is in flux and some is stored in pools and reservoirs, as shown in the image below. (Please click image to enlarge.) There is also a large amount of carbon stored in the earth’s crust. However, this is mostly in a fixed state, except for the removal of fossil fuels.
The Biogeochemical Process of the Carbon Cycle
[inlineImage|link|a96dafab10b043cdbe6e9d4a6c4b005988a39476||
]
This cycle is driven by three biogeochemical processes.
1. Biological Component
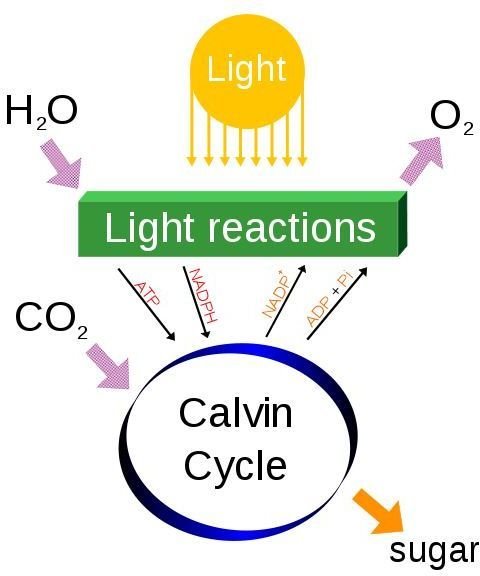
This is the process of photosynthesis and respiration by plants and living organisms. In photosynthesis the plants remove CO2 and H2O from the atmosphere and due to sunlight, process these into sugars and starches. The sugars give the plants energy to grow. Some CO2 is expelled back to the atmosphere and this process is known as respiration. In the carbon cycle, respiration provides the flux for the carbon. Photosynthesis provides a carbon pool in the stems and trunks of trees, as shown below:
2. Geological Component
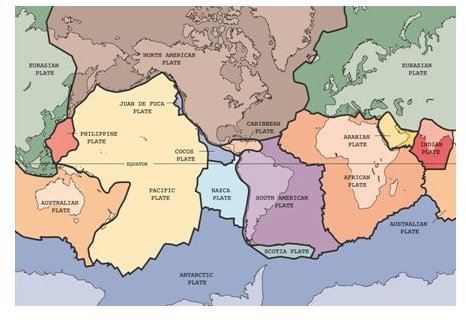
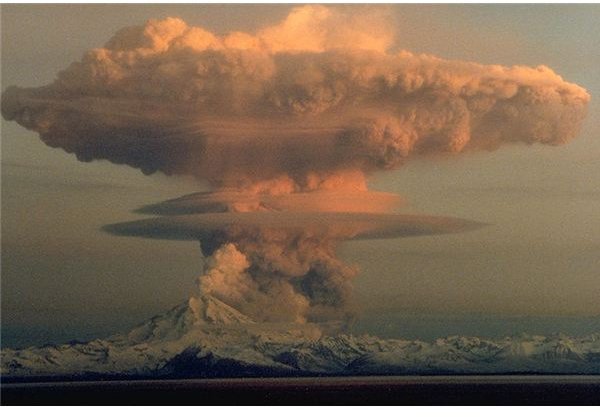
This is powered by the movement of tectonic plates that can cause volcanic action, with clouds of dust and gases including CO2 being emitted into the atmosphere. The major tectonic plates are shown below. The second image is not a nuclear explosion; it’s a volcano erupting.
Another part of the geological component, the rock cycle interacts with the carbon cycle through the weathering of rocks. The rocks are broken down by this weathering and the resulting ions are carried to the oceans by rivers and streams. Here they are converted to minerals such as calcite (CaCO3) through chemical reactions with sea water, eventually forming limestone. The limestone can be subjected to high temperatures causing it to melt and rise to the surface as CO2.
The CO2 can also be released gradually through ocean seeps or in larger quantities, and more violently by an underwater eruption much like an underwater volcano. The flux between the oceans and the atmosphere, part of the ocean carbon cycle, is shown here.

3. Chemical Component
This is a human activity due to emissions from the combustion of fossil fuels and cement production. If we look back to the start of CO2 emissions to the atmosphere, this began during the Industrial Revolution in the 1750’s. It was in this period that Britain began to use coal to provide steam and iron foundries were springing up. These processes produced large amounts of CO2 emissions that have continued to rise to today’s estimated total of 29 GtC (gigatons, or 29 milion tons, of carbon).
A graph showing the rise in CO2 emissions commencing from the Industrial Revolution is shown here:

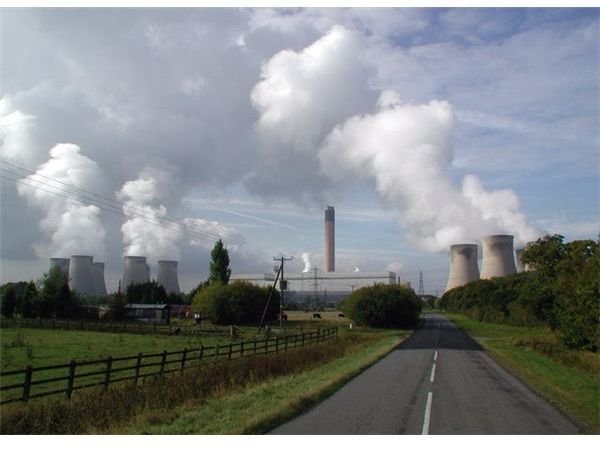
- Power Stations.
Power stations worldwide are responsible for the greatest amounts of CO2 emissions. The United States emits 41% of all CO2 emissions from power stations.
Coal-fired power stations are the worst culprit and although the western world is slowly beginning to mitigate these stations, the third world are building more as coal is cheaper and readily available, making it unfortunately the most predominant fossil fuel used in power stations. Coal fired power stations emit 2249 lbs of carbon for every MWh of power produced. Oil-fired power stations emit 1672 lbs/MWh while natural gas plants having the lowest emissions of all at 1135 lbs/MWh.
- Domestic Sector
This is made up of the use of fossil fuels for heating and cooling the home as well as cooking. Gas and oil are the most common fuels used, taking over from the old coal fires in developed countries.
Household energy accounts for on average of 20% of overall energy use in the developed countries and substantially more than this in the developing countries.
- Transport Sector
This sector is another high producer of CO2 from the use of petroleum and diesel in our automobiles, trucks, trains, ships and airplanes. Some emission values in grams/ton/kilometer are shown below.
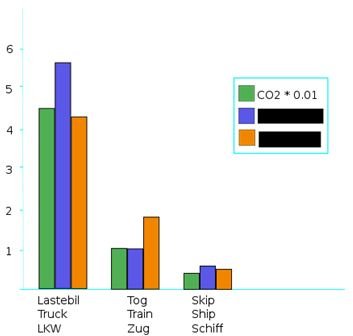
However with the research and development in hybrid engines, along with hydrogen powered vehicles, emissions from transport are being reduced.
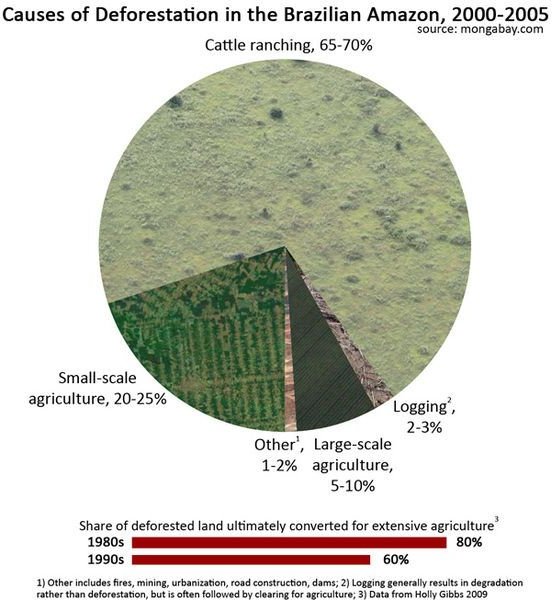
- Deforestation
Large amounts of trees are still being cut down throughout the world to make way for cultivation of crops and to supply the furniture and building industries with wood. This is particularly prevalent in the Amazon Rain Forests where large sections are disappearing daily, and along with them goes one of the world’s largest sinks of carbon. Uses from de-forestation are shown here.
- Cement Production
The cement making procedure is one of the most energy consuming processes in industry through all stages of its production. The energy used averages 4 GJ/Ton of cement produced whilst emitting over 2 GtC to the atmosphere. Cement clinker production using chemical reactions uses 50% of the total energy. This image is of a cement manufacturing kiln.

Percentage of Global CO2 Emissions Caused by Anthropogenic Activities
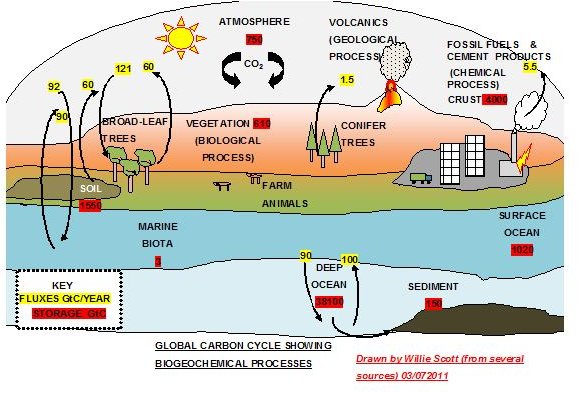
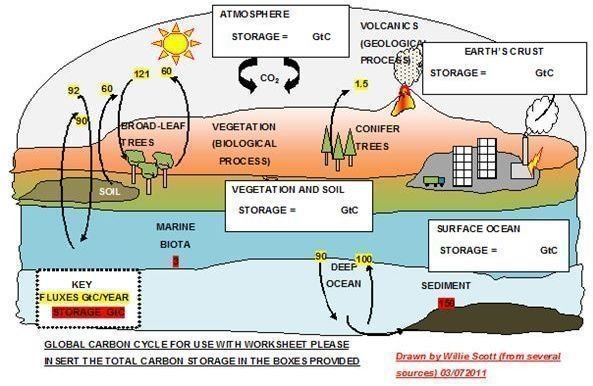
I have integrated information from several sources into the above sketch that explains the carbon cycle and shows the cycling of the major fluxes and the carbon storage locations. Although there are various estimates from the available data and are constantly changing, it gives us a good overview of the carbon cycle.
As far as anthropogenic activities are concerned, these have been predicted to continue to increase despite many governments’ attempts to mitigate CO2 emissions and global warming. These governments are reducing their CO2 emissions through abiding by some of the resolutions and recommendations of the International Panel on Climate Change (IPCC), several of which have been ratified through the Kyoto Protocol.
The percentage of anthropogenic emissions of CO2 against the overall carbon fluxes and storage locations is calculated from the figures obtained from the IPCC. A sketch of the fluxes and sinks from their website is shown below.
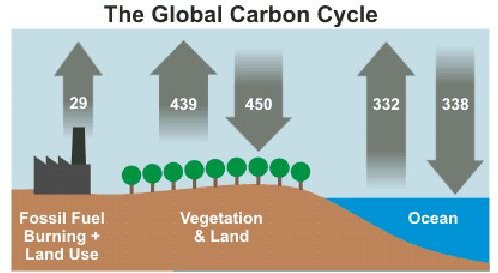
Total CO2 moving through the atmosphere = 750 gigatons.
Total anthropogenic emissions of CO2 from burning fossil fuels = 29 gigatons.
Therefore % anthropogenic = 29/750 = 0.039%.
So now we know the approximate percentage of anthropogenic CO2 emissions against the total CO2 in the carbon cycle works out at a very surprising low figure of 0.04%. But remember, this CO2 is increasing daily as only about 45% of this is absorbed by the oceans and land mass. The other 55% remains in the atmosphere where it is continuously building up and, according to our leading climate scientists, is the major gas causing the greenhouse effect, responsible for global warming and climate change.
As we have seen earlier, most of the world’s governments are signed up to mitigate these CO2 emissions. They can achieve this through the use of natural gas in our power stations in place of coal, land and marine renewable energy generation, the use of bio-fuels and hydrogen in our transport, and through the promotion of higher energy efficiency in industry and our homes.
A massive reduction to these emissions could come from the research and development of carbon capture and storage; however this must not take the place of the aforesaid mitigating measures, but be incorporated into them.
Websites Referenced:
1. cdaic: Emission trends.
2. Visionlearning: Carbon Cycle.
3. unh: Global Carbon Cycle.
4.Usgcrp.gov: Carbon Cycle Science Plan.
A worksheet with diagrams to label and questions (with answers) is on the next page.
Carbon Cycle Worksheet
This carbon cycle diagram worksheet can be used for tutorials or for personal information. The answers are noted below the questions in bold font. I have added a few diagrams that need information inserted. All of the information is in the article. Good luck!
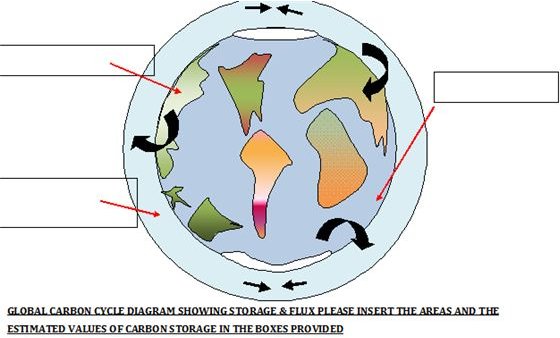
Diagrams to label for carbon cycle. (Please insert information into the boxes provided)
Worksheet for Carbon Cycle - Practice Questions with Answers
1**.** What component does a volcano supply to the biogeochemical processing of carbon?
This is part of the geological component, caused by movement of tectonic plates. Other volcanic emissions include SO2, ash, HCI, and HC.
2. What is the biological component of the biogeochemical processing of carbon?
The biogenic component consists of photosynthesis and respiration.
3. We know that photosynthesis takes place by the plants using solar energy to convert CO2 and H2O from the atmosphere into sugars and starches. These are used by the plants to stimulate growth that along with the release of a small amount of CO2 is known as respiration. But what is the chemical equation for photosynthesis and respiration?
The chemical equation for photosynthesis is:
6CO2 + 6H20 + light > C6H12O6 + 6O2
The chemical equation for respiration is:
C6H12O6 + 6O2 > 6CO2 + 6H20 + energy, which is the opposite of that of photosynthesis!
4. What is the chemical component of biogeochemical processing of carbon?
The chemical component is human induced mostly by the burning of fossil fuels and the manufacturing of cement and concrete.
5. What are the three primary fossil fuels, and which one produces the most CO2 emissions during combustion?
The three fossil fuels are coal, oil, and gas. Coal produces the most CO2 upon combustion and is very commonly used in power stations as fuel because it is found in abundance in many parts of the world and because it is the least expensive. This is why coal fired power stations are top of our energy production of CO2 emissions.
When combusted in our power stations,
- Coal produces 0.37: (kgCO2/kWh)
- Oil produces 0.26: (kgCO2/kWh)
- Natural gas produces: 0.23 (kgCO2/kWh)
6. Where is the location of largest carbon storage in the world carbon cycle?
The deep oceans contain the largest carbon storage being estimated at 38,100 GtC. (gigatons carbon).
7. What is the difference between carbon reservoirs and fluxes in the world’s carbon cycle?
Carbon reservoirs are where the carbon is stored. The transfer of carbon between reservoirs is known as carbon fluxes_._ These two processes combine to form the Global Carbon Cycle.
8. What are the sources of the main anthropogenic (man-made) CO2 emissions?
Anthropogenic sources are:
- Burning of fossil fuels in power stations, our homes, transport, and in cement production.
- Deforestation such as cutting down the trees in the Amazon Rain forest, this reduces the amount of CO2 the remaining trees can remove from the atmosphere.