With CO2 emissions on the rise and concern about it continuing to rise in higher concentrations due to industry, scientists are coming up with ways to chart and pinpoint areas of the country that are contributing to CO2 emissions. This knowledge will help control and regulate CO2 emissions.
The Vulcan Project: What is it?
Recently, Dr. Kevin Gurney, Ph.D and his team of scientists at Purdue University have been working on an overlay, or API, for Google Earth. The Vulcan project entails pinpointing areas of CO2 emissions in the United States. There are indicators that show also by what sources these emissions are being introduced into the atmosphere
Historically, CO2 emission data represented the data in correspondence to population; it was assumed that more highly populated areas produced more CO2 than other areas. The Vulcan Project seems to have displaced this notion. It provides representative data and can actually trace the emissions to their true sources- sources mainly based on activity and industry. It was long thought that the populous, industrial northeast was the major contributor to CO2 emissions; however the Vulcan project found the southeast to be the worst.
Vulcan Project Creation, Utilization and Sole Purpose
This remarkable undertaking by the Purdue university researchers came from combining data from LANDSAT 5 satellite imagery, information collected from Environmental Protection Agency carbon emissions data, and the U.S. Census Bureau, as well as Department of Energy population data. Combining all these sources of data made for a miraculously resourceful and useful depiction of data that can be utilized by many organizations.
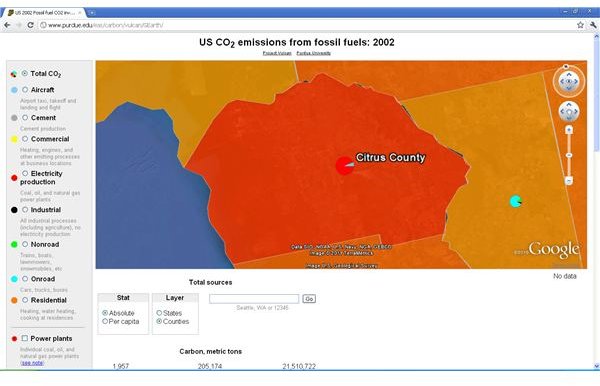
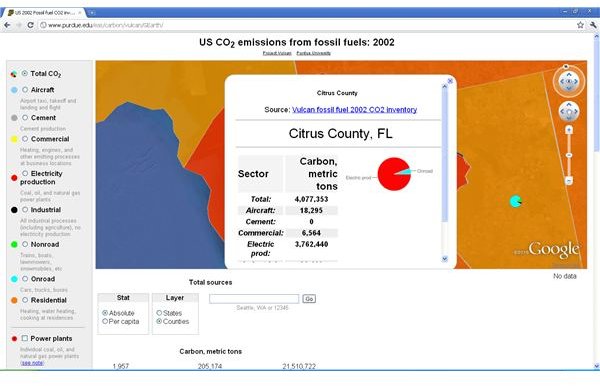
This data is displayed on a county-by-county basis. Pie charts displayed in participating counties show the percentages of the source(s) contributing to CO2 emissions. Sources of high CO2 activity where data was gathered can include power plants, car/highway activity, airports/aircraft, homes, and naturally occurring emissions. By clicking on each source, specific numerical data that can display the amount of discharge of CO2 is displayed.
Dr. Gurney’s motivation for this project is to be able to recognize an emerging need for global quantification of greenhouse gasses (GHG) and present the scientific data in ways entities such as governmental organizations, research disciplines, and public as well as private organizations would use.
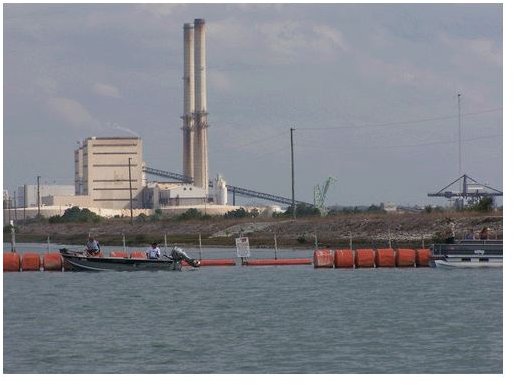
The following below is a portion of the Vulcan map showing a county that’s a couple of counties from where I reside. (Please click the images to enlarge.) They depict a significant power usage due to a well-known nuclear power plant in Citrus County, FL. As you can see, a good majority of the pie is related just to this electrical production.
Who Will Utilize the Vulcan Project?
Carbon Scientists perform research to find out what happens when humans interfere with the environment by pumping more CO2 into the environment than it can handle.
Typically, before the human influence of industrial activities and deforestation, the global carbon cycle was in relative balance. The oceans exchanged approximately 90 billion tons of carbon per year with the atmosphere, and the atmosphere exchanged around 120 billion tons of carbon a year with the biosphere, or land. With the introduction of humans into the system, approximately 8 billion tons of CO2 are being emitted into the system, but only 3 billion is being taken in by the atmosphere, leaving the remaining 5 billion unaccounted for at this point.
Then it became known around 2 billion tons of carbon per year is being pumped into the oceans due to something known as Henry’s Law, where if you bring a concentration of soluble gases over a water, some of that will dissolve into the fluid. So there is an accounting for where this portion of CO2 gas emissions goes.
The remaining three were discovered was being introduced into the biosphere. This portion is known as the “missing sink,” which basically means we do not know why this is occurring nor the mechanisms involved.
That being said, the research does reach a conclusion that if the CO2 concentration reaches a certain threshold or tipping point, the environmental consequences of the outcomes are rather concerning. Thus, the importance of the Vulcan Project to account for CO2 emissions from various specific areas of the system, i.e. – power plants, highway activity, deforestation, farming, etc.
Accounting for whatever is occurring with the missing sink, if this were to weaken or saturate, it could double the amount of CO2 being retained by the atmosphere. This would make CO2 concentrations much worse than they are currently. Learning what is occurring here is important to know when it comes to the evolution of CO2 emissions.
Policy Makers – currently, there are bills in place to provide regulatory legislation for regional greenhouse gas emissions. Right now, policy makers have only a blunt tool at their command- because they have no real idea of the location these emissions in the system.
That being said, the Vulcan project will provide policy makers a more precise instrument, or a metaphorical “scalpel,” to pinpoint when, where, and why these emissions are happening.
Basically, there are places that are not averse to beneficial regulation (even if it hurts in the short run), but they’d like to avoid the entire legislative process, which can prolong results. By providing Vulcan usage data to the policy makers, this tool can indeed give specifics to help gain a keen eye into getting legislation done effectively.
The Public – the Vulcan project provides a great way for the public to understand the source of CO2 emissions by using an already familiar Google maps interface.
Source Links
Google Tech Talks Video: How to count ALL Human Carbon Emissions in the US by Dr. Kevin Gurney
Perdue Site - About Project Vulcan
Green Muze: Google Earth Vulcan Project