Formatting Microsoft Access Graphs: Visual Basic
Introduction to Graphs
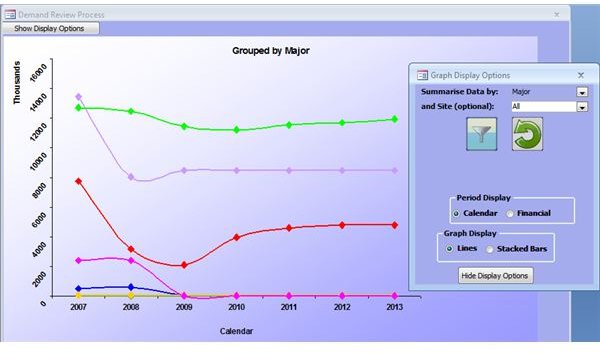
Graphs can be a very powerful way of presenting a summary of your data, but like any other form or report in Access, they are based on a table or query in your Access database. It’s very easy to create a graph using the built-in wizard, but what if you want to allow your users a range of options so that they can display the data that they want to see? By using VBA to alter the source of your graph as well as the settings used to display it, you can give your users a wide range of options.
Altering the Source Data
The simplest way to give your user some control over the graph is to allow him to alter the range of data. I usually find it best to create a table that holds the data for a graph, and add a yes/no field that determines which records should be shown on the graph. In the graph pictured above, you could use SQL commands in VBA to alter the date range visible to the user, e.g.:
DoCmd.RunSQL “UPDATE
Then you need to refresh the graph itself.
[Forms]!
The filter button on the graph above allows the user to choose which series (lines) should be displayed on the graph. I created another table with each series and a yes/no field to determine whether they should be shown. The button opens a form with the data from that table, and then updates the main graph data table based on the user choices:
DoCmd.RunSQL “UPDATE
Then refresh the graph again.
Changing the Appearance of the Graph
When working with Microsoft Access graphs, Visual Basic–as usual–allows you to change pretty much any aspect of the graph through code, whether it’s functional (changing the way the data is set out), or purely cosmetic (changing the color of the background or the lines).
In order to make any of these changes, you’ll need to declare the graph object in your code
Dim grph as Graph.Chart
Set grph as [forms]!
If you right click on the graph in design view and go to properties, you can view/set
Here are a few things you can do now:
grph.ChartTitle.Text = “This is the title of the graph”
With grph.Axes(1, 1)
.HasTitle = True
.AxisTitle.Caption = “This is the x-axis text”
End With
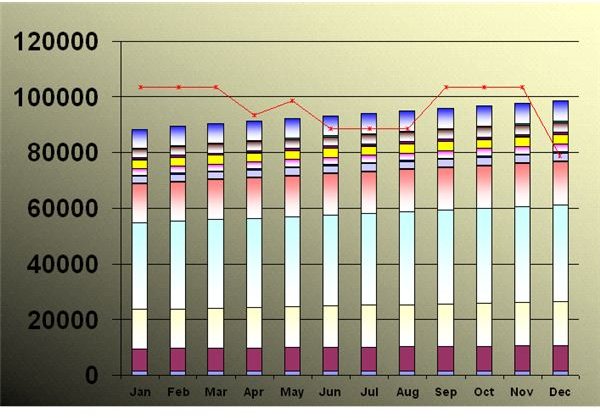
grph.ChartType = 52 - This sets the graph to a bar graph
grph.SubType = 2 - This then sets it to a stacked barchart.
If you want to set the graph back to a line type, you can use this code to set every line back to a curved type.
grph.Type = 4
For X = 1 To grph.SeriesCollection.Count
With grph.SeriesCollection(X)
.Type = 4
.Smooth = True
.Border.Weight = xlMedium
End With
Next X
You can combine these to create a bar graph with a single (or group of) line series, by setting everything to a bar chart, then setting specific series to lines.
For X = 1 To grph.SeriesCollection.Count
With grph.SeriesCollection(X)
.Type = 3
End With
Next X
grph.SeriesCollection(“Name of Line Series”).Type = 4
That should be enough to help you create some Microsoft Access graphs with Visual Basic.
References and Images
Based on writer’s experience.
Screenshots created by the writer.