Using Concept Mapping for Students that Struggle with Science
Concept Mapping in Science Classrooms
For visual learners, being able to visualize learning and being able to create visual models of how science concepts connect and scaffold on each other requires a different way of connecting the dots. Concept mapping is a visual way of connecting the dots for students with special needs in science classrooms.
There are a number of strategies that science teachers can use to introduce concept mapping in the classroom and integrate it as a visual tool throughout the school year. When students understand that concept mapping can be used to help them understand and connect the meaning of science concepts and vocabulary, they will be more open to using a tool that will make learning science easier and accessible.
Strategies in Concept Mapping
In order to make concept mapping an integral part of your science classroom, use the following strategies to help students become instantly engaged in the process of using this visual form of learning science.
-
Concept map the lessons for the semester on a large whiteboard and post in a highly visible place in the classroom. If students can see the bigger picture for science units that will be learned during the semester, then they can anticipate lessons, labs and science homework assignments and plan accordingly.
-
Take a unit and start with listing the vocabulary words. Have students create a concept map of familiar and unfamiliar words. For example in a unit on “Energy Resources,” the vocabulary list might include the words: renewable, nonrenewable, conservation, fossil fuels, global warming, electric power, solar energy etc. Students can create two lists: familiar science vocabulary and unfamiliar science vocabulary as headings and provide definitions to both list of words. Students can further the concept map into “renewable energy forms and nonrenewable energy forms and concept map the types of power under each heading.”
-
Give students whiteboards or if they are working in groups, provide each group with a piece of butcher paper and markers and have them create concept maps and present out to the class. Have them explain why they chose to categorize science vocabulary or concepts in a particular mapping. This will increase retention of knowledge for future application on projects or labs.
-
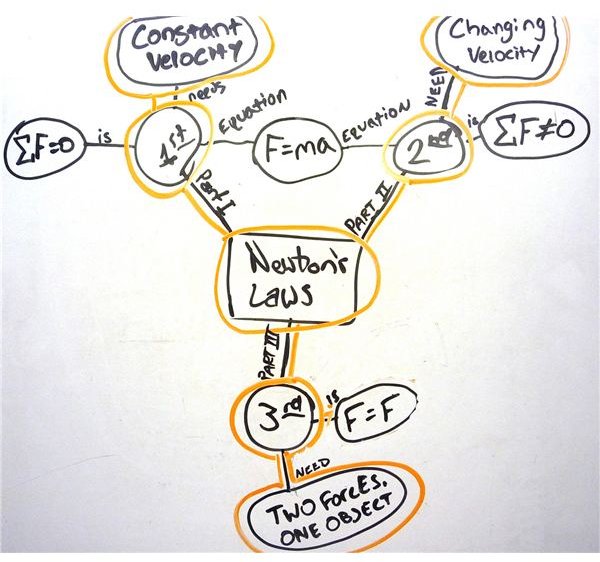
Ask students about the organization of their concept mapping and why circles or squares were used to define each concept or vocabulary word. Ask them about the lines that interconnect word meaning and ask them about relationships. For example if a group’s concept map started with the big picture of “Energy Resources” with arrows going down to “Renewable and Nonrenewable Energy Forms” and further arrows pointing to “Solar power and fossil fuels,” ask students what the relationships are and have them define and make the connections.
-
Provide an assessment by giving them vocabulary words or concepts that interrelate with each other and have them work individually or in small groups to organize them into a logical concept mapping and explain why.
Students can use concept mapping in building effective study guides that will allow them to review their learning and engage in independent study and understanding of what they’re learning in science classes.
References
- Photo by Waifer X under CC BY 2.0 via Flickr