Using and interpreting a CPU and Memory Monitor
Monitoring Performance
Your computer is an incredibly complex machine running dozens of processes at any given moment. But of course your computer has limited power to handle all those windows and programs you have open. So sometimes it is helpful to have a monitor that displays the two most important factors in your computers performance: your CPU usage and your Memory (or RAM) usage.
Your CPU is what is handling all the things you tell your computer to do while your Memory is storing everything you have open for real time access by your CPU. So if you run out of CPU your computer will slow down as your CPU struggles to accomplish all the tasks you’ve given it. If you run out of memory then you won’t be able to open any new programs (or windows) without closing some that you have open.
It is important to be able to monitor your usage so that you can keep track of your computers performance. Here are two basic ways to do this.
Windows Task Manager
Windows Task Manager is one of the best ways to monitor your CPU and memory usage and it doesn’t require you to download any new programs since it comes on any Windows operating system. To open the Task Manager you can either search for it in the Start Menu or press Ctrl+Alt+Del (at the same time)–in Windows XP this will automatically bring up the Task Manager while in Windows 7 and Vista it will give you the option to open it.
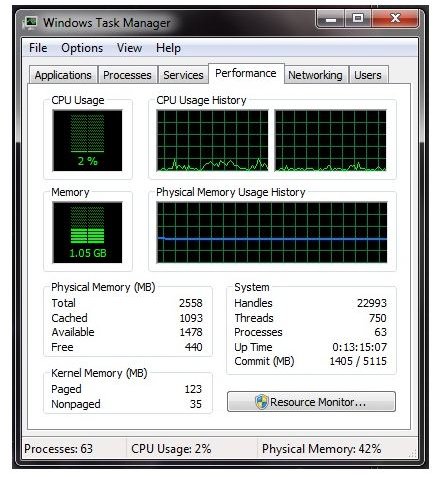
In the Task Manager there are several tabs with lots of information. If you want to monitor your CPU and Memory, move over to the tab that says “Performance.” It should look something like this:
The performance monitor shows a few relevant things. First there is a bar showing your CPU Usage. This is the percentage of your CPU that you are using at any given time. To the right of that is you CPU Usage History. This graph shows the amount of CPU usage over time. This is a helpful feature since you can see if some programs require a huge amount of processing power if they cause a huge spike in CPU usage when opened.
Below that is the Memory bar which shows the amount of memory you are currently using. The bar demonstrates the percentage of memory used while the number listed is the amount of memory being used in gigabytes (GB). To the right of this is the Physical Memory Usage History showing your Memory usage over time so that you can see how programs affect your Memory.
Below these graphs is more detailed information about your memory and system but for the basic user this may be a bit too much information.
For quick reference, at the bottom of the Windows Task Manager box it has the number of processes currently running (as you can see, mine has 64 which is quite a few), the CPU usage percentage, and the Memory percentage.
CPU Monitoring Gadgets
Sometimes, however, Windows Task Manager can be a bit bulky to keep up on your computer if you want to be able to glance at your computer’s performance at any time. The easy solution to this is to grab a performance monitoring gadget off the Internet. For example, you can use CPUmon or PowwwerSoft or Performance Monitor. The programs and gadgets will give you the same information at Windows Task Manager but in different forms that are sometimes more detailed but usually more convenient and easy to look at. For our purposes, lets take a look at CPUmon since it is an extremely lightweight easy to use gadget that you can keep running at any time.
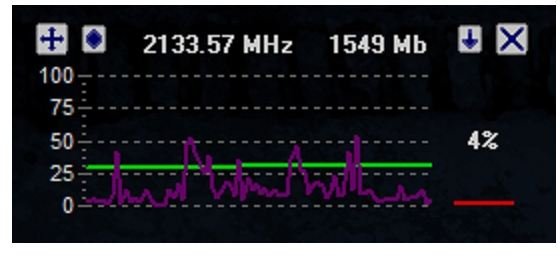
CPUmon has a very simple appearance. On it is a simple graph showing the real time usage of your CPU and Memory over time. The color of the two lines representing your CPU usage and Memory usage can be customized so you can easily distinguish them. To the right of this graph is a bar showing your current CPU usage. Above this graph is two numbers, one showing the amount of processing power you are using and the other showing the amount of memory used. This puts all of the information we saw in Windows Task Manager in one easy to use window.
All of this menu can be customized in the settings for quick reference. You can also set it to stay on top of other windows (which is the default) so that no matte what you have open the graph is still there. This isn’t a bad idea since the graph itself is clear so it is not too invasive. If this is annoying simply uncheck the “Always on top” button in the settings menu.
With a gadget like this up you can quickly and easily see your computer usage and make adjustments if need be. If those graphs are always hovering up towards the top then perhaps its time to upgrade!