How to Monitor CPU Usage Across Network Boundaries
RPTG Network Monitor
Using a good network monitoring tool not only helps a network administrator to quickly find and resolve network bottlenecks and failed devices, but can also helps to identify network components that are going into an error state so that remedial action can be taken to prevent downtime and asset loss. In this article we will look at how the RPTG Network Monitor tool can help to remotely monitor network throughput, system temperatures and CPU usage across network segments.
PRTG Network Monitor runs full time on the Windows based machine to which it is installed and can record and store various device parameters that are running on the network. Once PRTG is properly configured it can send alerts via email, SMS and ICQ as well as generate reports according to the Network Administrator’s preferences.
Setting Up RPTG
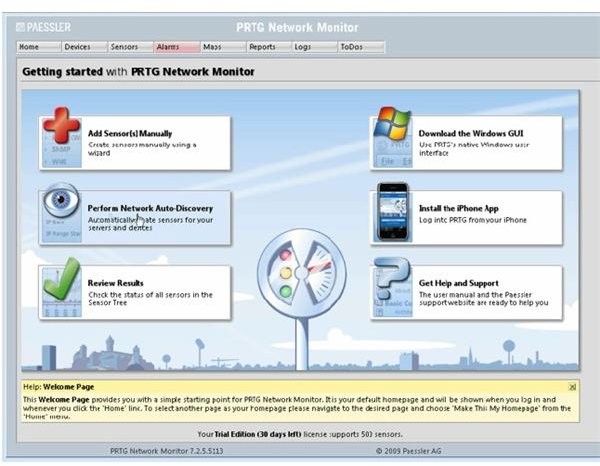
After installing the software it will automatically detect the host machine and allow you to start adding sensors for that machine. When you run the installation you will get an option to use the freeware version, run and unlimited 30-day trial or purchase the Commercial Edition. While the freeware version only allows the use of 10 sensors, paid users have access to all the other features.
As part of the setup process, you can run the Network Auto-discovery tool to find all the devices (servers, client computer, routers etc) on the network that respond to SMTP requests. After the discover process is complete you can then create an optimized set of sensors for each device, including one to monitor a device’s CPU usage – the Auto-discover tool can be found on the home screen of the tool.
Adding a Sensor to Monitor CPU Usage
-
From the PRTG home screen click “Sensor” > “Add Sensors”.
-
Click “Add sensor to and existing device.”
-
From the right panel select the device that you want to monitor.
-
Scroll down to “Windows Systems (WMI) and click to expand the list.
-
Select “WMI CPU load”.
-
Click “Continue” to move to the “Basic Sensor Settings” page.
-
Enter a name and tags for the sensor; you can leave all the other settings at the default.
-
Click “Continue” to go to the next page. In a few minutes you should have data from the remote device as well as access to sensor reports.
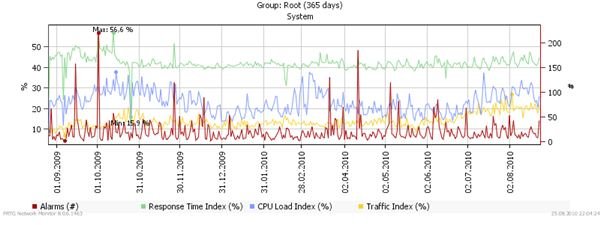
After the sensors are set up you can then create maps, which in essence are reports that you can use to see reports on live or historical data according to your preferences. These reports can then be viewed using RPTG’s web interface, which in theory makes it possible to access the reports from wherever there is Internet access.
Networking Monitoring Tools
Of course there are other network monitoring tools that you can use to monitor CPU usage across a network, but PRTG should meet
the needs of most administrators whether they need to monitor a small network or a large network with remote devices spread out across the globe. If you need the Enterprise Edition of PRTG, prices start at $400, for 100 sensors, and can reach much as $32,000 for and unlimited number of sensors.
You can use the program for free, though it will be limited to the use of ten sensors. As we stated before, you get the full feature set of the program regardless of whether you use the free or unlimited edition, and the only thing you are limited to is the number of sensors that are available.
PRTG also has a iPhone/iPad/iPod Touch app (OS 3.x or later) that can be use to remotely monitor CPU usage whether you are in separate room or half way across the world. Of course you will need to setup the PRTG server for remote access via the web interface. You can download a free trial of PRTG if you like.
References:
“PRTG Network Monitor,” https://www.paessler.com/prtg
Image Credits:
“CPU usage across network - Graphical Report,” https://media.paessler.com/common/img/prtg8rootgraph.png
“PRTG Network Monitor - Home Screen,” Author