Nothing But The Facts About Sunspots
Introduction
Definition: Sunspots are dark areas of reduced temperature on the surface of the Sun.
Formation: These are formed due to irregularities in surface temperature caused by the intense magnetic activity on the surface. The magnetic field inhibits convection in certain areas resulting in relatively cooler regions on the surface.
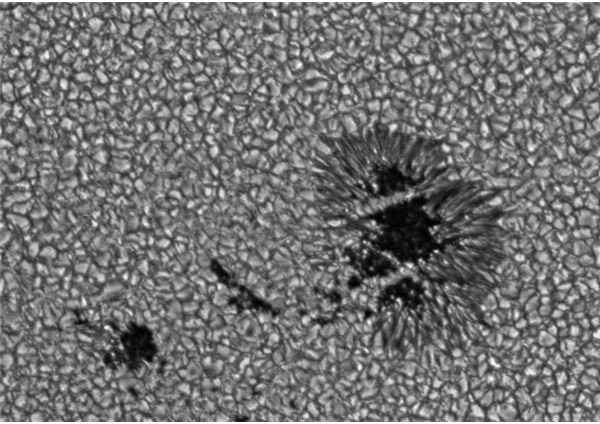
Appearance: Sunspots, when looked at closely, comprise of a dark central zone (umbra) and a slightly less dark peripheral zone (penumbra). The umbra has a higher magnetic activity than the penumbra_._
Right bottom: Sunspot with a dark central umbra and a peripheral penumbra. Image: NASA
Timeline
28 BC: Apparently, the first reference to sunspots by Chinese astronomers.
813 AD: Reference of sunspot observation in Europe.
1129 AD: John of Worcester described sunspot activity. Averroes (Ibn Rushd) also described sunspots in the same century.
1610 AD: Sunspots were telescopically observed for the first time by Thomas Harriott, Johannes and David Fabricus.
1611 AD: A description of sunspots was published by the above mentioned astronomers.
1612 AD: Galileo and Christoph Scheiner almost simultaneously made observations of sunspots.
1826-1843 AD: Observations of the sunspot cycle were carried out by Heinrich Schwabe who publsihed the results in 1844 AD in “Astronomische Nachrichten”.
1848 AD: Rudolf Wolf started making systematic observations of sunspots.
1848 AD: Joseph Henry showed that sunspots are cooler than the surrounding surface.
Interesting Facts
1. Large sunspots are usually twice as big as the Earth’s diameter. The largest sunspot seen since 1900 is “The Great Sunspot of 1947” which was around 40 times the Earth’s diameter.
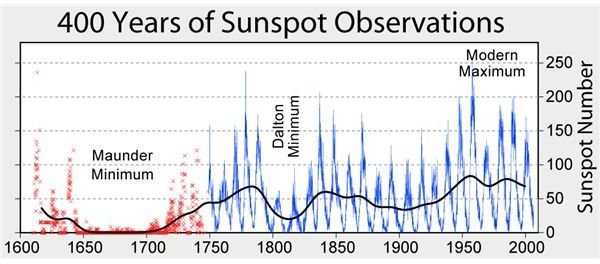
2. The sunspot activity during the second part of the 17th century was extremely low. This period is known as the Maunder minimum. This coincided with the “Little Ice Age” (1645-1715) and is believed to be responsible for it.
Right: Image showing sunspot activity for the last 400 years. Credits: Robert A. Rohde. https://en.wikipedia.org
/wiki/File:Sunspot_Numbers.png
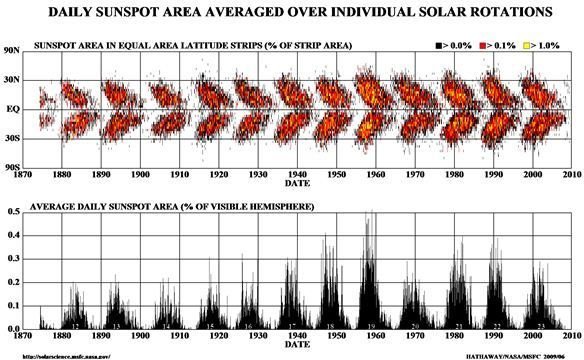
3. The sunspot activity is not irregular. The phenomenon has a 11 year cycle of high to low activity. The transition from one cycle to another is not sharp and is marked by the change in overall polarity of the sunspots. The cycle is demonstrated by a famous diagram called “The Butterfly Diagram”
Right Below: The Butterfly diagram. Credits - NASA.
4. Wolf Number: In 1849, Rudolf Wolf introduced the concept of recording sunspot number. This was a very peculiar number taking into account not only individual sun spots but also the number of groups of sunspots. Taking into account sunspot groups reduces the variation due to observation of small sunspots by some observatories. Wolf’s number ‘R’ is given by
R = k(10g + s)
k = observatory factor
g = number of groups of sunspots
s = number of individual sunspots
The Wolf number can be used to denote the solar activity and determine the period of the sunspot cycle.
5. Although sunspots appear dark and are relatively cooler regions on the Sun, they are still as hot as about 4500 K. All known metals would melt at this temperature. They are also a lot brighter or more luminous than the full moon. They appear dark because the surrounding regions of the Sun have a temperature of about 5500 K.
References
1. https://solarscience.msfc.nasa.gov/SunspotCycle.shtml
2. https://en.wikipedia.org/wiki/Sunspot
3. https://en.wikipedia.org/wiki/Wolf_number
4. https://solarscience.msfc.nasa.gov/feature1.shtml
5. https://www-das.uwyo.edu/~geerts/cwx/notes/chap02/sunspots.html