Understanding Accounts Receivable Turnovers: The Activity Ratio Explained
Determining the Credit Collection Efficiency of a Business Entity
The proportion between total credit sales vs. the average receivable balance during a specific business cycle is called the turnover ratio. Its significance is that it denotes the number of times non-cash sales were collected and realized as actual funds. The favorability of the results after comparing the said accounts denotes collection efficiency and effective implementation of credit-granting policies.
However, how does one determine whether or not the resulting comparison is regarded as favorable?
Explanations and examples of the formula by which the ratio is computed will illustrate the rational in making this comparison. The formula takes into account the sales revenues generated by way of giving credit privileges to customers, divided by the average receivable balance maintained during the year’s business cycle.
Accounts Receivable Turnover Ratio (ARTR) = Annual Credit Sales/Average Accounts Receivable Balance
Points to Consider Regarding the ARTR Formula:
-
Determining credit sales presents little or no difficulty at all, if the accounting method for recording sales establishes from the onset a distinction between cash sales (COD) and credit sales.
-
The ratio we intend to establish should be in accordance with the “apples to apples” concept of comparing two accounting elements covering the same period: Credit sales vs. credit extended to customers lodged under Accounts Receivable (AR) during the year.
-
Some businesses, however, simply classify all selling activities as sales revenues without taking into account how much of the sales generated were actually realized as cash at point of sale and those realized at the point of collection.
-
In emphasizing this factor, using total sales revenues comprising both COD and credit sales may not provide the best index on which to gauge the favorability of “selling-on-credit” activities during the year.
-
If the business does not make a distinction in recording COD and credit sales, one can still manage to perform this formula effectively by adding-up all debit entries in the AR ledger for the same period. This is after ascertaining that all debit entries made in the AR ledger originated from accounting entries to record sales generated via credit, i.e.
Dr. Accounts Receivable ———- $xyz
Cr. Sales ———- $xyz
- The matter of determining the average AR balance is another point to ponder. Traditionally, this was merely computed by adding the beginning balance and the ending balance of receivables and then dividing the sum by 2. Modern-day financial analysts, however, note that the resulting ARTR is a bit off-tangent or does not really conform to the objective one wishes to attain.
-
The AR beginning balance refers to the previous year’s sales activity, yet the objective is to gauge present activity with present turnover trend.
-
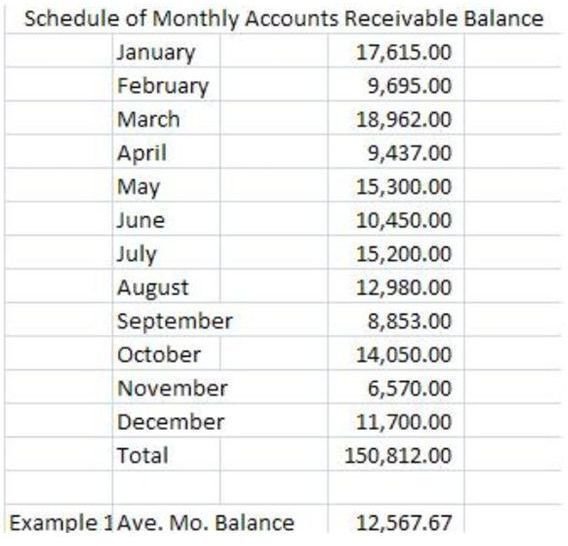
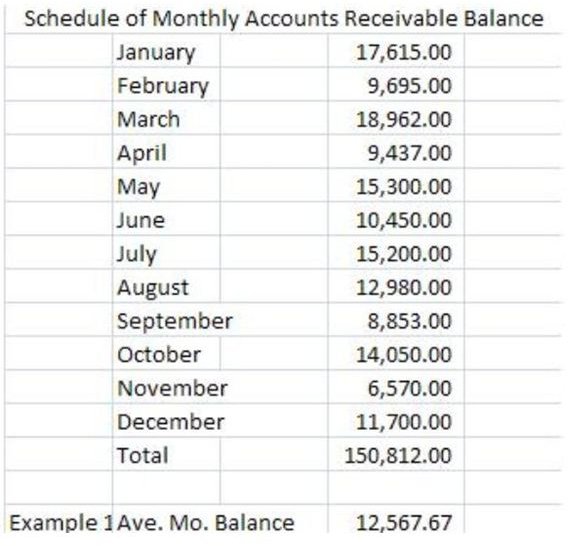
Since the aim is to determine collection efficiency by way of “apples to apples” comparison, a suggested method of computing the average receivable balance is to get the total of all month-end balances. Take another step further and divide the sum by 12 to get the average balance on a monthly basis.
-
To illustrate, click on the image on your left and find a Schedule of Monthlly Balances totaling $150,812, which was divided into 12 months in order to arrive at the average receivable balance of $12,567.67 per month.
After threshing out all these points of considerations, we are now ready to tackle examples for calculating the AR turnover ratio.
Examples of ARTR Computation
Example 1
The givens for this example are as follows:
Total sales revenue of $775,850 comprising COD sales of $345,620 and credit sales of $430,230. We will use the previously computed average accounts receivable figure of $12,567.67 per month, with the presumption that the Schedule of Monthly Balances pertains to the sales revenues mentioned here.
ARTR = Credit Sales / Average AR Balance
= $430,230 / $12,567.67
= 34.23 or 34 times in a month
-
Basically, this denotes that on a monthly average, there are 34 times in which credit sales are turned into cash at point of collection, which is a good indicator. Generally, customers are given only 30 days to defer payment on their purchases, inasmuch as this is an interest-free credit transaction.
-
Understand that the receivable balance decreases if customers pay the amount due. Thus, by dividing the total amount of sales on credit by the average receivable balance, this produces the number of times that the receivable account was reduced to its average amount. In effect, this is also the number of times that credit sales were collected..
-
Study the figures reflected in the Schedule of Monthly Balances, and take note that the AR ledger does not maintain large balances.
-
We will therefore be drawn to the conclusion that the total credit sales of $430,230 extended during the year were mostly realized as cash sales as of year-end, inasmuch as the balance of the receivables as of December is only $11,700.
This could be attributable to collection efficiency as well as proper implementation of credit-granting policies, by extending credit only to customers who are credit-worthy.
Example 2
In our second example, we will use a different set of givens except for the average receivable balance of $12.567.67 per month.
This time we will calculate the ARTR for a small-scale business that extends credit sales. Total sales revenues for the year is $120,000 comprising COD sales amounting to $55,000 and credit sales of $65,000. We will presume that the Schedule of Monthly Balances in our image pertains to these sales figures.
To calculate the ARTR = $65,000 / $12.567.67
= 5.17 or 5 times
-
The resulting ARTR indicates that there is a slow turnover or realization of cash at the point of collection.
-
The $65,000 credit sales will need further analysis regarding the length of time by which credit is extended, since there are only 5 occasions that the credit sales recorded as receivables, assumed balances near the average receivable balance.
-
This is also an indication that there are hardly any changes or movements in the AR ledger during each month.
Recommendations for Slow ARTR
The study and analyses of other profitability and activity ratios will further enlighten the business owner as to which aspect the slow turnover rate is attributable. Ratios like days receivable, inventory turnovers, and aging of accounts receivable, just to mention some, are used in conjunction with this analysis in order to pinpoint the potential causes of a slow ARTR.
Readers may refer to a separate article entitled Accounts Receivable Aging to find out how this tool will indicate that a slow turnover ratio may be due to collection inefficiency or poor credit management.
Reference Materials and Image Credit Section
References:
- Examples and schedules to illustrate AR turnover ratio were created by the author.
Image Credits:
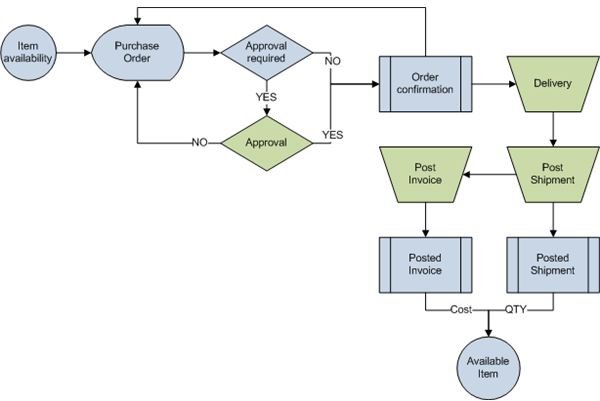
- Purchase process: GNU Free Documentation License – https://commons.wikimedia.org/wiki/File:Purchase_process.png
- Invoice from Van Ruyskensvelde Albert by loki11– https://commons.wikimedia.org/wiki/File:Van_Ruyskensvelde.jpg