Manufacturing Cycle Efficiency, Calculated: Its Relevance to Cost Accounting

Calculating Manufacturing Cycle Efficiency: Cost Accounting & Process Management Tool
Providing an example of how manufacturing cycle efficiency is calculated is one good way to emphasize the importance of process management. In a manufacturing concern, the efficiency of the work processes likewise entails cost accounting efficiency.
Manufacturing can be quite complex as it involves several stages or steps before an item becomes complete. Thus, best practices require proper process management in order to avoid the unnecessary time, space, or resources being consumed by process steps that do not actually add value to the goods being sold.
You may have heard of some start-up manufacturers who tend to encounter difficulties in meeting customers’ orders and thus lose continued patronage of their products. In other cases, competitors are able to offer lower prices that other manufacturers cannot afford because they have to recover a substantial amount of manufacturing costs.
What seems to be the difference between manufacturers who can meet deadlines from those who cannot? What about the manufacturers who can offer a more competitive price than those who have to recover a greater amount of manufacturing costs? We can find out the answers, by determining the manufacture cycle efficiency, calculated in our case study sample.
Knowing how manufacturing cycle efficiency (MCE) is calculated is only a part of a business process management system. Hence, there is also the need to know how to identify what seems to be ailing a particular business, which we will explain briefly by way of example.
Image Credit: B&P Manufacturing Liberator hand truck from Wikimedia Commons
Determining the Components of the MCE

Keep in mind that each step or process denotes time and resources that are consumed, with the expectation that they can be recovered with a reasonable rate of profit or value added. This profit represents the mark-up that is added to the selling price being offered to customers.
In understanding this, it would be important for the process manager to determine which process steps add value and which do not. These components are called value-added and non-value-added process steps and are defined as follows:
-
Value-Added Process Steps – The work performed within a manufacturing cycle that adds to the function or enhances the form of the product in such a way that it becomes a finished good that is pleasing or attractive to a customer. The latter, then, would be willing to pay additional value aside from the product’s manufacturing cost.
-
Non-Value-Added Process Steps – These steps are the exact opposite of the value-added steps wherein no form or functionality is contributed by the work performed, but they still form part of the manufacturing cost to be recovered and imputed in the selling price that customers have to pay.
Inasmuch as our goal is to determine efficiency, we have to first establish the total time that each manufacturing cycle takes, which is known as the cycle time or throughput time. The cycle time will then be identified as to which process steps are valued-added and which steps are non-valued-added, in order to assign the time-equivalent of these two components.
After determining their respective cycle time values, you can now calculate the manufacturing cycle efficiency.
Image Credit: Algots
The Manufacturing Cycle Efficiency Formula
After knowing the manufacturing cycle time and value-added cycle time, you can now use the manufacturing cycle efficiency formula to determine the MCE rate:
Manufacturing Cycle Efficiency (MCE) = Value-Added time/Manufacturing Cycle Time
The resulting quotients will then be expressed in terms of percentage by multiplying the number derived by 100%.
However, as some would say, it is easier said than done, especially if the process manager is at a loss on how to identify which of the process steps add value or which do not. Hence, we find it necessary to provide further explanations by giving the readers an example of how manufacturing cycle efficiency is calculated.
Read more about the manufacturing cycle efficiency, calculated in a complete example on the next page.
Example of How to Calculate the MCE
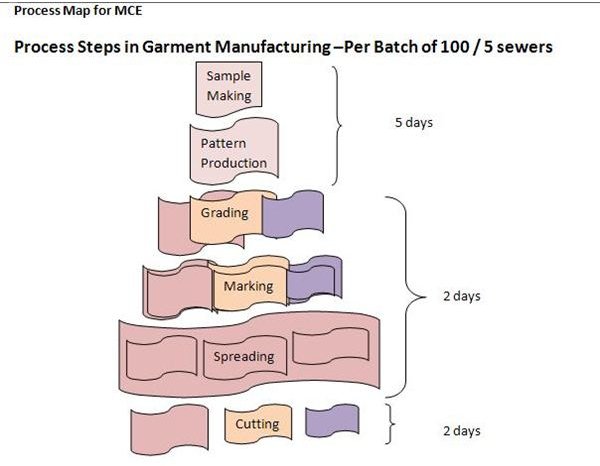
In calculating the MCE, your first concern is to identify the manufacturing processes involved. The best way to organize this is to create a process map. In our example, the work performed in each manufacturing cycle is for a batch of 100 garments assigned to 5 sewers.
-
The process map will help you identify which of the actions performed during the manufacturing cyle add value to the production of 100 garments. Kindly click on the image to get a larger view of the sample process map
-
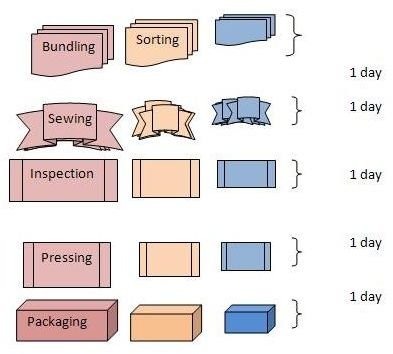
Jot down the process steps you have mapped out, together with the equivalent number of days or hours to complete each step. In our example, the process steps and their cycle time are as follows:
(1) Sample Making and (2) Pattern Production = 5 days
(3) Grading (4) Marker Making (5) Spreading = 2 days
(6) Cutting = 2 days
(7) Sorting/Bundling = 1 day
(8) Sewing/Assembling = 1 day
(9) Inspection = 1 day
(10) Pressing = 1 day
(11) Packaging = 1 day
- We summed up the equivalent number of days to get the manufacture cycle time, wherein we derive a total of 14 days.
- Classify the value-added time or those actions performed to transform the raw materials into 100 finished garments:
Cutting = 2 days
Sewing and assembling = 1 day
Total Number of Value-Added Days = 3 days
- Calculate the Manufacturing Cycle Efficiency using the formula: Value-added process time / Manufacturing Cycle Time
MCE = 3 days / 14 x 100%
MCE = 21.42%
Image Credit: Created by author cscantoria.to serve as visual aid for the explanations on MCE calculation
.
Understanding the Significance and Use of the MCE
We have established that for every 100 pieces of garments completed by 5 sewers in 14 days, only 21% of the actions performed add value in order to transform the raw materials into finished goods.
However, this does not mean that the remaining 11 days, which represent the non-value-added process steps, should be dispensed with. They are still considered necessary steps, in order to proceed to the value-added processes and attain completion as finished goods that customers are willing to buy at a value-added price.
What this tool aims to achieve is to identify the processes, for which alternatives or possible solutions could be applied, to lessen the non-value-added time spent in manufacturing a product. The cost accounting department, on the other hand, can come up with a better production cost on which to base the selling price.
To complete the said objective for this analysis, we have also come up with the recommended methods on how to lessen the non-value-added time it takes to complete a manufacturing cycle time in garment manufacturing:
- The use of CAD (Computer-Aided Design) or CAM (Computer-Aided Manufacturing) equipment in view of the speed, accuracy and ease by which samples, patterns, gradings, and markings can be completed.
- The establishment of critical points, where pre-inspections should be done before the garment undergoes the finishing process.
- The use of spreading machines, wherein fabrics spanning over 100 feet are mechanically stacked one on top of another.
- Other CAM equipment used for cutting, sorting, and bundling.
- Arranging the floor layout of the production area and the work stations where the flow of work can be done continuously without the need to physically transfer the raw materials-in-process to another work station.
These are only some of the recommendations, which most garment manufacturers have proved as effective and efficient work-process technologies and techniques. The cost of the CAD or CAM equipment will then be capitalized and allocated by way of depreciation, to match their contribution to revenue generation throughout the years of their useful lives.
Take note, however, that the examples of the process cycle time for garment manufacturing provided above are only examples. They should not be misconstrued as the representation of the standards for garment manufacturing process steps and cycle time. They are merely provided for the purpose of illustrating how manufacturing cycle time, calculated, can give emphasis on its significance as a tool for process management and costing.
.