What is a Histogram? Understanding Histograms for Proper Exposure
Introduction
A histogram is an important tool used to get accurate feedback on how well an image is exposed.
In the days of film, professional photographers spent a lot of time understanding how their camera’s metering system behaved and how they should expose the images when taking pictures. There was no instant feedback system, and there was plenty of room for exposure errors. Digital photography changed all that, making it possible to instantly review the image and take another shot if any corrections are required.
While playback on the LCD gives a fair idea of how an image is exposed, histogram provides a more accurate feedback, helping the photographers to take properly exposed pictures.
What is a Histogram?
Each digital image is made up of millions of pixels, and each of these pixels has a brightness level associated with it. In most cameras, there are 256 brightness levels, with zero representing a completely dark pixel, and 255 representing a completely bright one. A histogram is a graph representing the distribution of brightness of pixels in an image. The graph is plotted as number of pixels against each brightness level.
How to see and interpret histograms?
Most high-end point-and-shoot cameras and almost all digital SLR cameras are equipped to display the histogram on their LCD screen. Refer to your digital camera’s manual to find out how to view the histogram of an image. Advanced image processing software, like Photoshop and Gimp, can also be used to see the histograms once you load the image onto a computer.
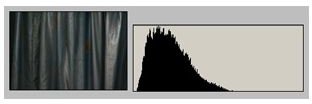
For a dark or under-exposed image, the histogram is usually taller at the left side of the graph. A histogram of a bright image is taller on the right side. The images below demonstrate interpretation of a histogram. Here, a sample subject is shot three times, each time with a different exposure. Along with each image is the histogram corresponding to it.
The above image was under-exposed. As you can see, the graph is taller on the left, which indicates that most of the pixels are on the darker side.
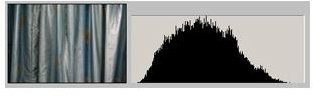
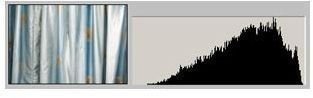
This image was properly exposed. You can see more pixels towards the center of the graph. The image seen below was over-exposed, which has more pixels concentrated to the right side of the graph.
This way, a graphical representation of brightness helps to understand if the image is exposed properly.
How to use it when taking pictures?
When taking photos, the most important use of a histogram is to check the exposure. Verifying the histogram after taking a picture helps to decide if exposure correction is necessary, and by how much.
Note that a histogram with a lot of bright or dark pixels may not always mean that there is an exposure error. It also depends on the subject you are shooting. For example, if you are shooting in a place where there is a lot of snow, it is natural that most of pixels are bright. Similarly, it is normal to have many dark pixels if you are shooting stars in the night sky.
Another important use of histograms is to check if an image has burnt pixels. The presence of brightest pixels (brightness level 255) in an image often means that some part of the image is blown out to pure white because of over-exposure. Details of such sections of the image are permanently lost and cannot be recovered. Most cameras indicate such burnt parts of the image by blinking those sections on the display. If you see any blinking parts in an image, it normally means that the image is over-exposed, and it is time to adjust the exposure.