Learn about Popular Content in Your Website with Google Analytics
Report Overview
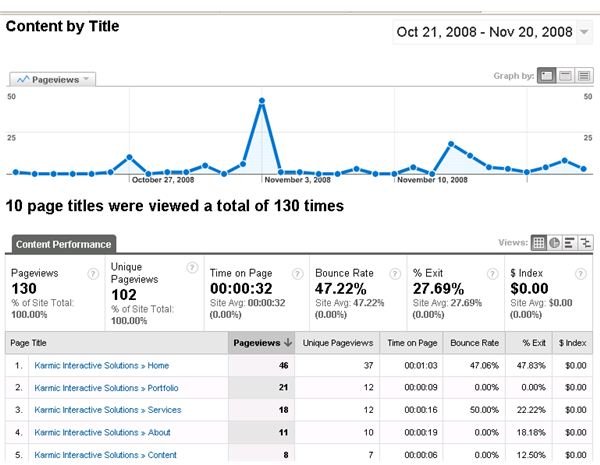
This report can be accessed by logging into your Google Analytics account. Click Content, and then Content by Title. The report will look something like this:
Just like the Top Content report, you’ll see statistics on the visits and pages of your site like this:
- Page Views: Total number of page views for the specified date range.
- Unique Page Views: Number of page views by new visitors to the site.
- Time on Page: Average time the user spent looking at the page.
- Bounce Rate: This is the percentage of people who click onto the site and click on to something else very quickly. Either because your site did not provide what they were looking for, or they did not mean to arrive at it in the first place.
- % Exit: This is the percentage of users who exit the site after viewing the page.
Instead of seeing the pages listed by directory or file name, information on this report is listed by the title you use on your site, which makes it easier for you to keep track of the data.
Making this Report Work for You
Now that you’re able to view the statistics of your pages by the title of the page, you’ll have a much easier time analyzing the data. You’ll be able to clearly see where you want the majority of the traffic to be, compared to where the majority of the traffic is. Using this information, you will be able to develop a plan of action to stream traffic into the more important pages on the website.
If you need more traffic coming to a certain page, make sure you have good content on the page, the page is optimized for search engines, and useful to your audience. Then, shift your advertising campaigns to send traffic to those URLs to see how things happen. Remember though, any changes you make should be monitored as the oringal site, because some changes could improve your site, but depending on the site and the audience, some changes could actually cause a decline in traffic.
The best hing to do is to make one change at a time so you can watch each one and see how it works out. When a change in the site reflects a positive change in the traffic and other metrics you are working with, move on to the next one. If the change reflects negatively, try another change there until you get positive reactions from your audience. You can always conduct surveys to help you decide which course of action to take.
This post is part of the series: Improve Your Website Content with Google Analytics Report Data
Learn about all the Google Analytics Reports under the Content area. This will help you understand more about your website content and help you make it better to get more traffic and higher conversions.
- Improve Your Website Content with Google Analytics Report Data
- Google Analytics Reports: Top Content
- Google Analytics Reports: Content by Title
- Google Analytics Reports: Content Drilldown
- Google Analytics Reports: Top Landing Pages
- Google Analytics Reports: Top Exit Pages
- Google Analytics Reports: Site Overlay
- Google Analytics Reports: Site Search