Learn more about your visitors with the Google Analytics New vs. Returning Report.
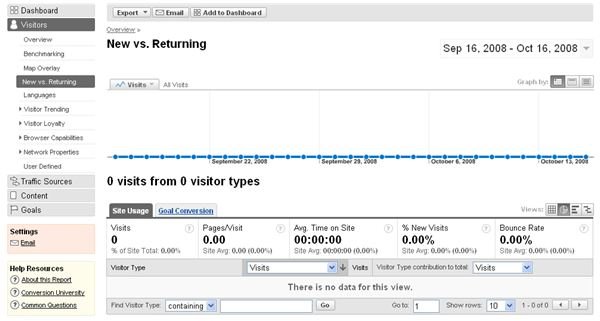
To see the Google Analytics New Vs. Returning Visitor Report, login into your Google Analytics account. Click View Reports to get to your dashboard. From there, you will need to click Visitors, and then click New vs. Returning. You should see a screen that looks something like this:
This report will show you the following information:
- Visits: This will provide you with how many times your Web site was loaded in a browser.
- % New Visits: This will tell you how many of your visits were new compared to the entire number of visitors.
- Pages per Visit: This will provide you with how many pages the average user is taking a look at while on your site.
- Average time Spent on Site: This will tell you how long your users are browsing and using your site.
- Bounce Rate: This will tell you in a percentage how many people came to your site and left on the same page they came in on.
With this information, you can find out a lot about your Web site and how it is working for you and your business. When looking at your statistics, you should ask yourself these questions.
Is my advertising working? If you’ve recently started an advertising campaign, you’ll probably see a spike in new visitors. But, that doesn’t mean anything If they aren’t staying to explore or use the site. You either need to change your advertising to cater to a more specific audience, or you need to adjust your content to make it more relevant to the crowd you’re bringing in. This is where several other reports will come in handy on Google Analytics.
Is my bounce rate normal? If the bounce rate seems high, that usually means that people are not finding your site useful and are moving on to others. Make sure you adjust your advertising to bring in a different crowd, or adjust the content. Adjust one at a time slowly, and watch for trends to see if you can pinpoint what it is.
Are people using my site? If the average time spent on the site is good, that means that whatever you are doing is good. People are sticking around and exploring the site. That usually means whatever is on your site is relevant to them, and they like it.
As with the other reports on Google Analytics, you can change your views and compare any facet of this information to another factor to see if the two are related. To do this, click the different icons on the Views tab underneath the graph and statistics information. Use the drop down menus below to change your views around.
Remember, you can use the dropdown box in the upper right to change the date range that you are viewing so as to see if the spike in visits coincides with advertising campaigns. Or, you can see whether or not a reduction in visits corresponds with a server outage.
This post is part of the series: Learn More about your Visitors with Google Analytics
This series takes a detailed look at the reports offered in the Visitors tab in Google Analytics. Learn about all the reports, what they track, and how you can use them to improve your site.
- Google Analytics: Learn More about your Visitors
- Google Analytics Reports: Benchmarking
- Google Analytics Reports: Map Overlay
- Google Analytics Reports: New Vs. Returning Vistors
- Google Analytics Reports: Languages
- Google Analytics Reports: Visitor Trending
- Google Analytics Reports: Visitor Loyalty
- Google Analytics Reports: Browser Capabilities
- Google Analytics Reports: Network Properties
- Google Analytics Reports: User Defined