Microsoft Access 2007 Reports
Reports are the Windows and Doors to Our Database
An MS Access database report is a window to our database. The “window” can be designed to show all or some of the data in our data tables. We can also group and display the data and, through queries and formulas, “crunch” numbers entered into our records. In other words, as a window, the report gives us a complete, partial or restricted look at our information. We can also make our reports serve as “doors” by attaching queries to our reports, thereby literally “dialing up” a report on a particular set or subset of your information.
Creating a Simple Report in Microsoft Access 2007
Microsoft Access 2007 has taken much of the drudgery and confusion out of creating a report, especially in the design mode. Let’s look at the steps for creating a report directly from a table and then redesign the report for a desired grouping (by sales area in our example).
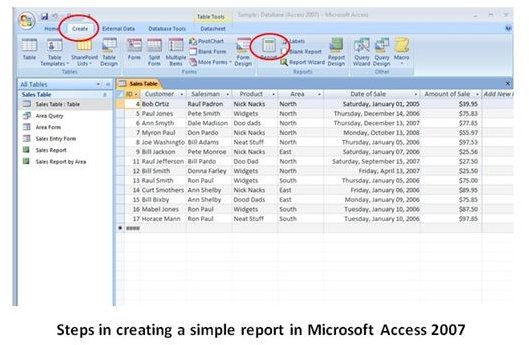
To create a report from a table, do the following steps:
♦ Open the table in the datasheet (table) view.
♦ Click on the Create tab.
♦ In the Reports group, click on the Report icon.
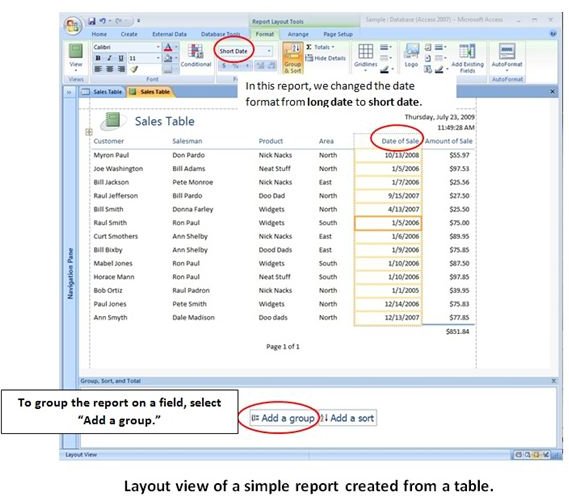
♦ A report based on the table will open in the new Layout view.
In Access 2007, you can rearrange the column widths, and locations. You can also reformat numerical data (dates, numbers, currency) using the groups on the Format tab. (See the screenshot of the report in layout view.)
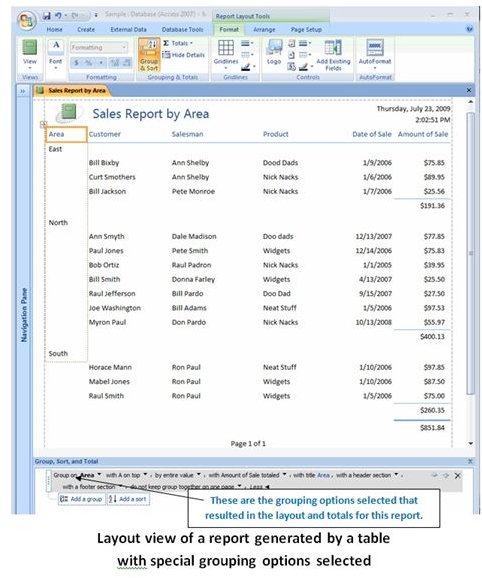
To change or add groupings to a report, do the following steps:
♦ Click on the View dropdown list in the upper left of the report window and select Layout.
♦ Click on Add a group beneath the blue Group, Sort, and Total bar at the bottom of the report window.
♦ Select the name of the field you wish to sort on. (In our screenshot example, we chose the Area field.)
The newly grouped report appears and can be tweaked further. We added subtotals to each Area grouping by selecting More > and adding a footer and specifying that the sales be subtotaled.
Steps and Results of Creating a Report from a Table
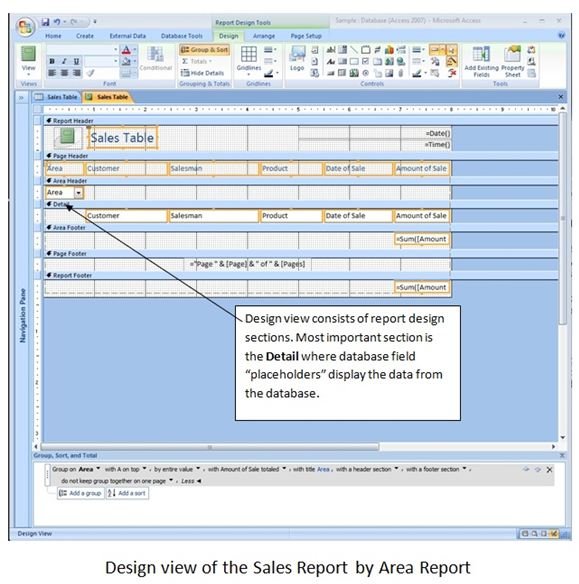
Learning More About Report Design
To get a basic idea on how Microsoft Access 2007 reports are structured, open report in its Design view. Access reports are designed much the same way as forms with individual sections. The most important section is the Detail where “placeholders” to list the data from our table fields. Designing a Microsoft Access 2007 report from scratch, however, can be somewhat arduous, though. It is best to automatically generate the report and then go into the Layout and Design modes for groupings and field arrangement changes.
More Information on Microsoft Access 2007 Reports
Microsoft Office Online: Making a Simple Report in Access
MS Office Tune Up: Creating a Simple Report in Access 2007
This post is part of the series: MS Access Databases
Microsoft Access is a powerful tool for database management. This article series introduces the new user to database structure. Read all about database objects and how to tailor your data use through tables, forms and queries.