Using Power View in MS Excel 2013
Requirements
Power View can utilize data from either a local Excel spreadsheet or data from a SQL 2012 Analysis Services server. Reports can be saved to a SharePoint 2013 server to be viewed in a web browser or they can be created and viewed within Excel 2013. Before you get started you will need to install the Silverlight plugin on your computer. If you go to create a Power View sheet the first time and are prompted to install Silverlight, proceed with the installation. Otherwise, for the rest of this article, we will be using Excel 2013 for both the data source and report viewer.
Getting Started
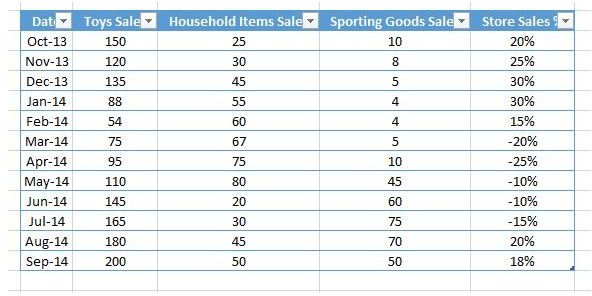
To get started, open Excel 2013 and create a new spreadsheet. Start by lying out your data with named columns across the top of your spreadsheet. These column names will become the fields in Excel’s underlying model of your data. As you can see in Figure 1 I’ve set up a simple set of data outlining sales data by department per month for a fictional store.
Select the data you wish to use in Power View and click Format as Table on the Home menu. Ensure the ‘My table has headers’ checkbox is checked and click OK. This way if you add new data rows to your table your Power View will also update automatically.
Now, select your table and navigate to the Insert menu. Click on ‘Power View’ under the Reports heading. If you’ve never used Power View before you will be prompted to enable the add-on. Note that this will also install the Power Pivot add-on. Click ‘Enable’ to enable Power View.
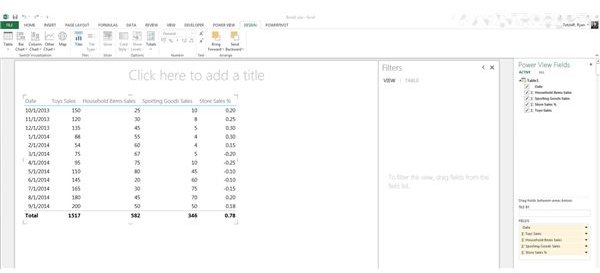
You should be taken to a new tab in your workbook that has the Power View interface displayed (Figure 2).
Using Power View
The Power View sheet will be broken into several sections. Along the top is the Power View menu tab. This tab gives you various options for modifying the look of your Power View form. Below the menu tab is the main report view. This is where your report will be created. Just to the right of the report view are filters and to the right of that is the Power View Fields list.
The Fields list will let you select the data from your model which will be displayed and in which order it will be displayed in. If you click on various elements of your report you will see additional menu tabs appear next to the Power View menu. For example, click on the main list in the report and you will see the Design tab appear.
Customizing Your Power View
Let’s modify our list by doing the following actions:
- Filter out the 2013 dates.
- Remove the Sales % field.
- Change the summary line into averages instead of totals.
- Turning the rest into a bar chart.
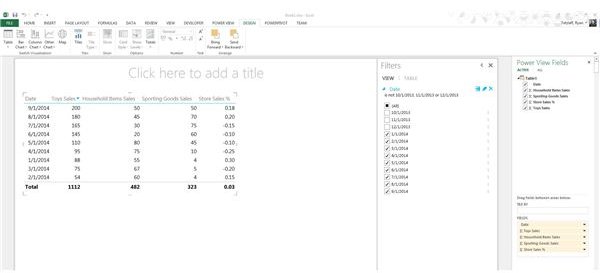
To filter out the dates, we will click and drag the ‘Date’ field from the Field list into the Filters area. Next, we will select All dates and then remove any of the 2013 dates. As you can see in Figure 3 we have removed the 2013 dates.
Next, we will remove the Sales % field by simply unchecking the field in the Power View field list.
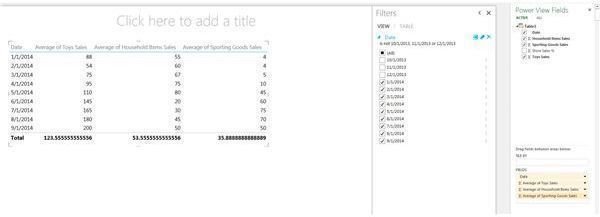
To change the summary line in the report to averages, we click the drop down box next to the Fields in the bottom section of the Field list. The summary line in the report will be updated as you change the fields over to the average value (Figure 4). Since the average is not a whole number in most cases, we can use the ‘Decrease Decimal’ button on the Design tab to remove the decimal places.
Next, we’ll turn the resulting data into a chart. Click anywhere within the report area and click the Design menu. Next, click on Bar or Column chart and choose the right chart for you. Your lackluster table should now be a great looking chart.
The great thing is that you can now give this report to someone to analyze and they will be able to utilize the filters to only report on the data they want to see. No need for them to understand the underlying data.
Power View can be used to produce some extremely powerful interactive charts and visualizations without forcing users to understand how the underlying data is structured. As this article just touched the surface when it comes to Power view, don’t be afraid to test some of the more advanced functionality!